ORCL Stock Week Ahead: Technical Outlook for November 9–13
ORCL stock week ahead for November 9–13: last close 116.10 USD, weekly change -11.15%, support 115.16, resistance 144.54.
By Elena Vance
November 7, 20264 min read
Advertisement
Logo Oracle — JournalArta illustration
Oracle enters the November 9–13 trading week after a sharp retreat that leaves its shares near the bottom of their recent range, with a steep technical downtrend set against strong reported quarterly growth.
Last Week in Review
Oracle fell 11.15% over the week ended November 6, closing at $116.10 after finishing the previous week at $130.67. The stock ranged from a high of $129.85 on November 4 to a low of $109.21 on November 6; its close sat in the bottom third of that weekly range.
Trading was heavy: average daily volume reached 71,850,380 shares, or 2.27 times the average for the preceding 20 sessions. The strongest session was November 3, up 5.85%, while November 2 was the weakest, down 8.76%. Shares rose in two sessions and fell in three, a lopsided week that ended with a modest 0.82% gain on November 6.
Technical Map for the Week Ahead
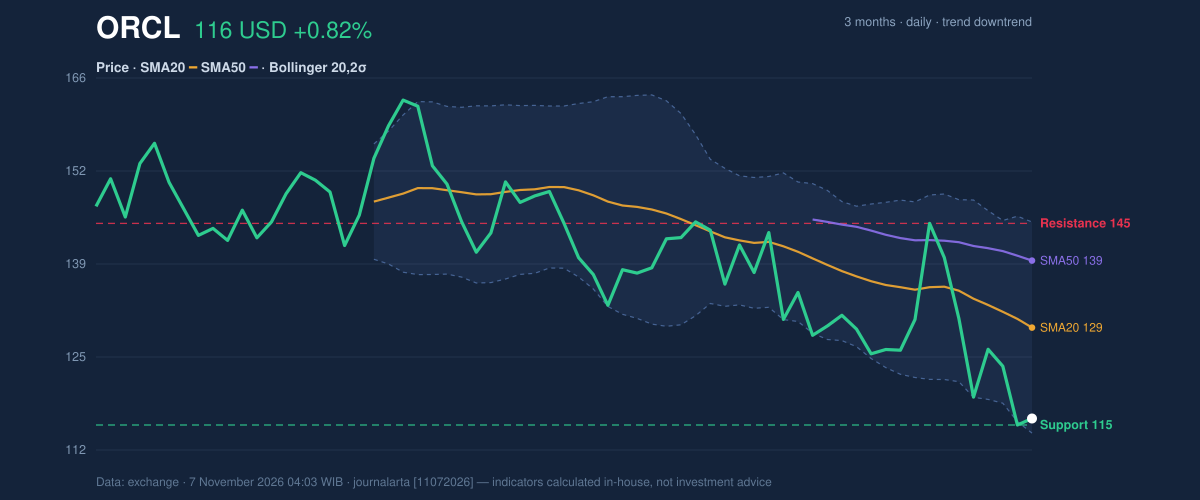
The chart remains under pressure. Oracle’s price is below its 20-day moving average of $129.36 and its 50-day average of $139.12. The 20-day average is sloping down by 3.99% over five days, while the 20-day support is $115.16 and resistance is $144.54. The broader three-month range runs from $109.21 to $170.70.
The Bollinger bands—an indicator of price range and volatility—are widening, with the lower band at $113.97 and the upper band at $144.74. Oracle’s position at 7% of the band’s range places it close to the lower edge. RSI, which measures the pace of recent gains and losses, is 38.5, a neutral reading; stochastic readings of 17.5 and 14.9 are in oversold territory, meaning recent declines have been pronounced. That may leave room for a short-term rebound, but it does not by itself establish a trend reversal.
The MACD remains negative at -5.187, below its -3.964 signal line, and its histogram is also negative. OBV, which tracks whether trading volume is flowing more heavily on rising or falling sessions, is declining. Average true range (ATR), a measure of typical price movement, is $8.90, or 7.7% of the share price—high volatility that makes nearby levels especially relevant.
3-month price action chart of ORCL: price, SMA20/50, Bollinger, support & resistance.
Advertisement
The price chart shows a stock testing support after a wide weekly decline. The momentum chart, by contrast, highlights oversold stochastic readings alongside negative MACD and falling OBV: a possible bounce signal is competing with evidence that selling pressure remains.
BULLISH SCENARIO: A sustained break above $129.36, the 20-day moving average, would be an early sign that the near-term slide is easing. The next major chart reference is $144.54, the 20-day resistance.
BEARISH SCENARIO: A break below $115.16 would put the 20-day support under pressure and expose the three-month low at $109.21.
Fundamentals and Catalysts
Oracle reported revenue of $19.35 billion for the quarter ended August 31, up 29.6% from $14.93 billion a year earlier, according to its Form 10-Q filed on September 11. The company also reported net income of $4.76 billion, compared with $2.93 billion a year earlier, and diluted earnings per share of $1.56, in figures published September 11.
Those results provide a growth backdrop, but they do not resolve the near-term technical weakness. The available company filings also include an Oracle Form 8-K filed with the U.S. Securities and Exchange Commission on November 4 reporting other material events. The filing date is the confirmed detail; no further event description is available in the provided research.
Advertisement
Macro, Political and Global Factors
The research provided contains no dated macroeconomic, political or global developments relevant to Oracle. No external drivers are added here; the week-ahead assessment therefore rests on the stock’s supplied price, volume and indicator data, alongside the company facts above.
Risks and What Would Invalidate the Scenario
A break below $115.16 would invalidate the short-term support case and bring the $109.21 three-month low into focus. On the upside, a move back above $129.36 would challenge the immediate downtrend; a failure to hold that level would leave the shares below both moving averages.
The main technical risk is that oversold readings can persist while a downtrend continues. Negative MACD, falling OBV, a declining 20-day average and wide Bollinger bands all point to continued pressure and elevated swings. Conversely, a move above the 20-day average would be more meaningful if momentum and volume also improved, rather than being a brief rebound within the broader decline.
Advertisement
Technical Verdict for the Week: HOLD
The supplied technical bias is neutral, supporting a wait-and-see stance rather than a directional verdict. The strongest reasons are the price below both the 20-day and 50-day averages, negative MACD with a falling OBV, and oversold stochastic readings that leave room for a bounce without confirming one. The verdict is invalidated if price breaks below the $115.16 20-day support.
Entry Range: $113.97–$129.36, using the lower Bollinger band and 20-day moving average as reference levels.
Target Price: $144.54, the 20-day resistance.
Stop Loss: $102.76, the price minus 1.5 times ATR reference level.
In plain English, the chart does not yet give a clear direction: support is close, but the broader trend remains weak.
ORCL Week Ahead Data
Trading week
November 2 – November 6 (5 sessions)
Weekly change
-11.15% (130.67 → 116.10 USD)
Week high / low
129.85 (November 4) / 109.21 (November 6)
Best / worst session
5.85% (November 3) / -8.76% (November 2)
Avg daily volume vs prior 20 sessions
71,850,380 vs 31,685,960 (2.27x)
SMA20 / SMA50
129.36 / 139.12
RSI (14) / Stochastic %K
38.5 / 17.5
Support / Resistance 20 days
115.16 / 144.54
3-month high / low
170.70 / 109.21
Week covered
November 9–13, 2026
Data as of
7 November 2026 04:03 WIB
Advertisement
Disclaimer: This technical analysis is generated automatically from exchange data and indicators calculated by JournalArta, for information and education only. The verdict and the entry, target and stop-loss levels are not investment advice or a solicitation to buy or sell any security. Investment decisions and their risks rest solely with the reader.