ORCL Stock Analysis: Gains 3.56%, Momentum Weakens
On Juli 16, 2026: price 132.49 USD, trend downtrend, RSI 30.1, support 127.94, resistance 188.33. technical analysis of orcl stock. Key angle: ORCL Stock…

Oracle Corporation (ORCL) finds itself at a precarious juncture, as the latest session saw the stock snap back to 132.49 USD, a 3.56% uptick that provides only a momentary reprieve from a punishing monthly decline of 31.22%. While the bounce off recent lows suggests a desperate attempt by market participants to find a floor, the broader technical posture remains dominated by a steep descent. Investors are grappling with the reality that the stock has been fundamentally uncoupled from its higher-tier moving averages, signaling that the current structure is defined more by corrective exhaustion than a structural trend reversal.
Trend & Price Action
The technical landscape for Oracle is defined by a deep-seated downtrend, evidenced by the share price lingering significantly below the SMA20 of 151.73 USD and the SMA50 of 180.97 USD. With the SMA20 slope contracting at a sharp -8.75% over the last five days, the stock is currently struggling to regain traction within a wide, volatile range. As of the most recent exchange data, the price sits precariously at just 8% above the 20-day support floor of 127.94 USD, dangerously close to the 3-month low of 127.60 USD.
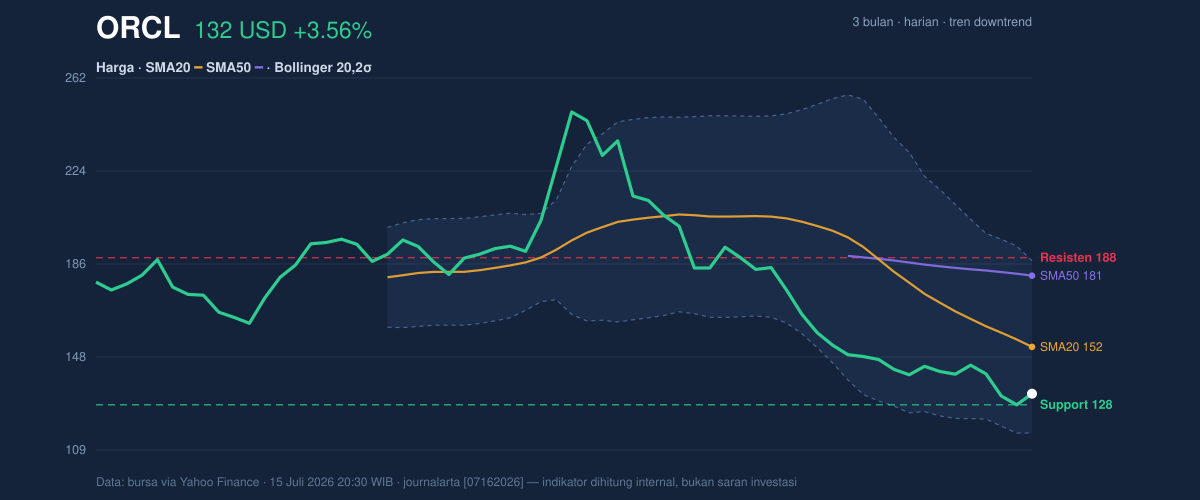
The price sits at a %B of 23% within the Bollinger Bands, indicating that while the stock is not yet technically outside the lower band, it is trading in the lower quartile of its volatility range. The expansion of the Bollinger bandwidth to 46.6% underscores that this price movement is not a quiet drift, but a high-conviction shift in sentiment characterized by elevated volatility.
Oscillators & Momentum
Momentum indicators offer a nuanced, albeit sobering, view of the current selling pressure. The RSI (14) stands at 30.1, sitting right on the cusp of the oversold threshold, which typically acts as a zone where selling velocity begins to dissipate. Simultaneously, the Stochastic %K at 16.3 and %D at 5.9 confirm that the stock has entered oversold territory.
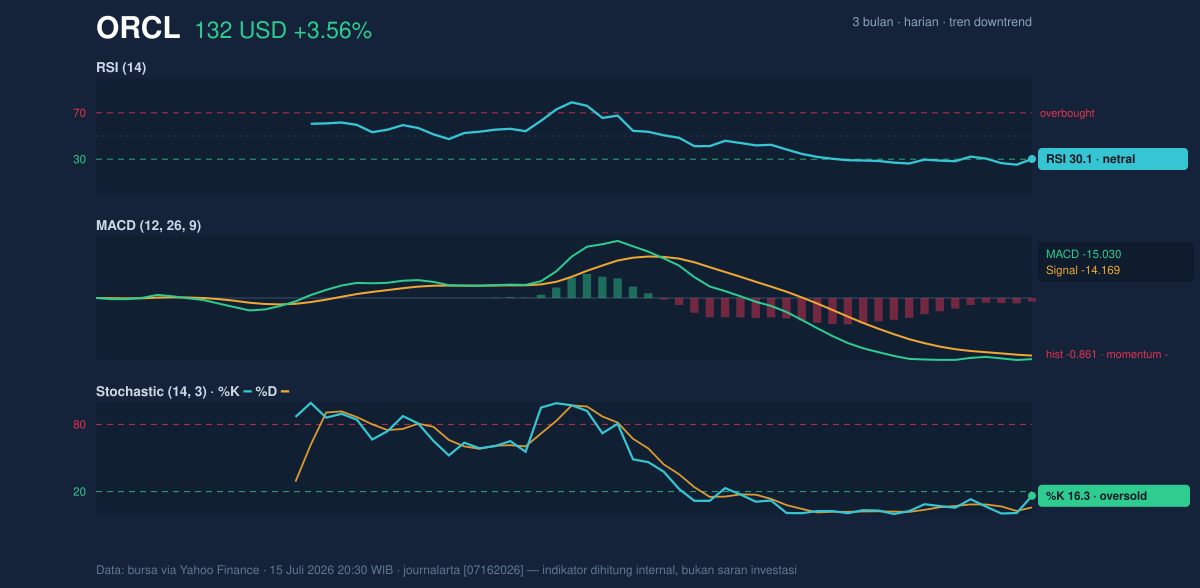
While these readings suggest that the immediate "washout" phase may be near its conclusion, the MACD remains firmly negative at -15.030 with a bearish histogram of -0.861, indicating that there is no underlying bullish momentum to support a sustained rally. Simply put, the oscillators are flashing "extreme exhaustion," but the trend-following indicators have yet to provide a single reason to call a bottom.
Volatility & Volume
The participation behind this move is significant. Trading volume reached 48,417,200 shares, roughly 1.3 times the 20-day average of 36,731,715. Usually, higher-than-average volume during a period of price weakness suggests capitulation—the moment when nervous holders finally abandon their positions. However, the OBV (On-Balance Volume) continues to track downward, confirming that the heavy trading activity is driven by aggressive selling rather than accumulation. With an ATR of 6.71, representing 5.1% of the share price, traders should prepare for continued, rapid oscillations that could easily test the lower Bollinger Band of 116.36 USD if the 127.94 USD support fails to hold.
Technical Verdict: HOLD (wait & see)
The technical evidence suggests that while the stock is statistically oversold, the lack of a positive MACD divergence or a break back above the 20-day moving average keeps this in a "wait and see" category.
* Rationale: The stock is in an extreme oversold state (Stochastic/RSI), but trading volume confirms continued distribution (OBV), and the price remains deep in a bearish trend (price below SMA20/50).
* Invalidation: The neutral-to-negative outlook is invalidated if the price clears the SMA20 of 151.73 USD with a sustained increase in volume.
* Entry Range: 128.00 – 130.00 USD (waiting for stabilization near support).
* Target Price: 151.73 USD (SMA20 test).
* Stop Loss: Below 126.50 USD (to mitigate risk of a breakdown below the 3-month low).
Ultimately, market participants are observing a classic "falling knife" scenario where the price is cheap by historical standards, but the momentum required to turn the ship around has not yet materialized in the data.
Summary Data ORCL
| Last price | 132.49 USD |
| Change 1 day / 5 days / 1 month | 3.56% / -5.69% / -31.22% |
| Trend / MA-cross | downtrend / none |
| SMA20 / SMA50 | 151.73 / 180.97 |
| RSI (14) / Stochastic %K | 30.1 / 16.3 |
| Bollinger %B / ATR | 23% / 6.71 |
| Support / Resistance 20 days | 127.94 / 188.33 |
| Data as of | 15 Juli 2026 20:30 WIB |



