PYPL Stock Week Ahead: Levels and Scenarios for November 9–13
PYPL stock week ahead for November 9–13: last close 59.24 USD, weekly change 3.91%, support 54.99, resistance 60.20.
By Alistair Sterling
November 7, 20264 min read
Advertisement
Logo PayPal — JournalArta illustration
Last Week in Review
PayPal shares rose 3.91% on Nasdaq during the week ended November 6, closing at $59.24 after opening the first session at $57.68. The stock traded between $57.26 on November 2 and $60.87 on November 4, finishing at 55% of that weekly range. Its strongest session was November 4, up 3.42%; its weakest was November 5, down 2.06%. Shares advanced in three sessions and fell in two.
Trading was comparatively quiet: average daily volume was 10,873,080 shares, or 0.95 times the 20-session average of 11,471,925. The weekly gain came on slightly below-average turnover.
Technical Map for the Week Ahead
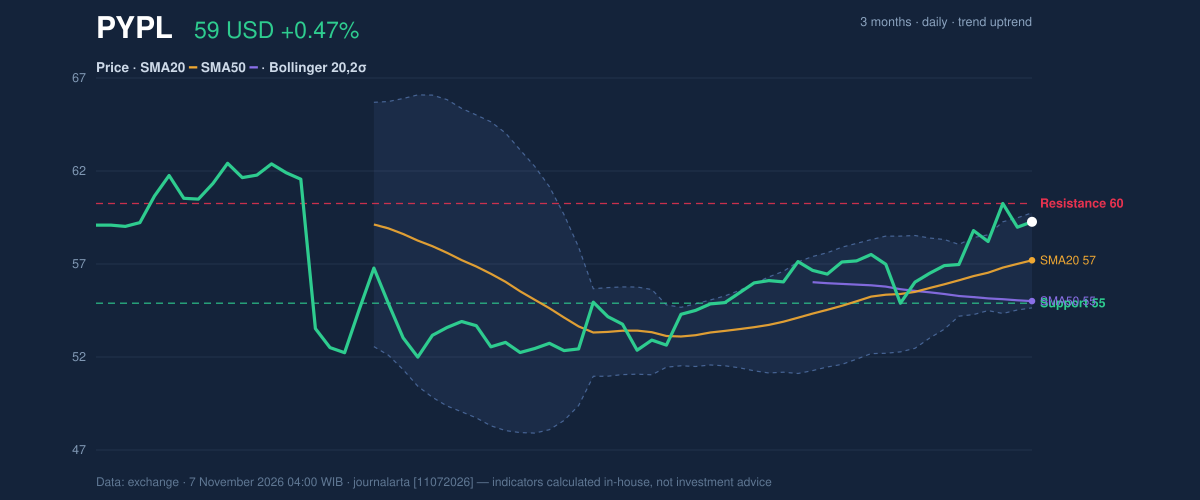
PayPal enters the November 9–13 week above both its 20-day moving average at $57.23 and its 50-day average at $55.10. The 20-day average is rising, with a slope of 1.86% over five days, while the stock’s longer three-month range runs from $50.80 to $62.73. The nearest 20-day support is $54.99 and resistance is $60.20.
The chart is pressing toward its upper boundary.
The price chart below puts that test in context: the November 6 close was near the upper Bollinger band at $59.71, with the middle band at $57.23 and the lower band at $54.74. The band width is 8.7%, a normal reading, while %B at 90% places the close near the top of the envelope.
3-month price action chart of PYPL: price, SMA20/50, Bollinger, support & resistance.
Advertisement
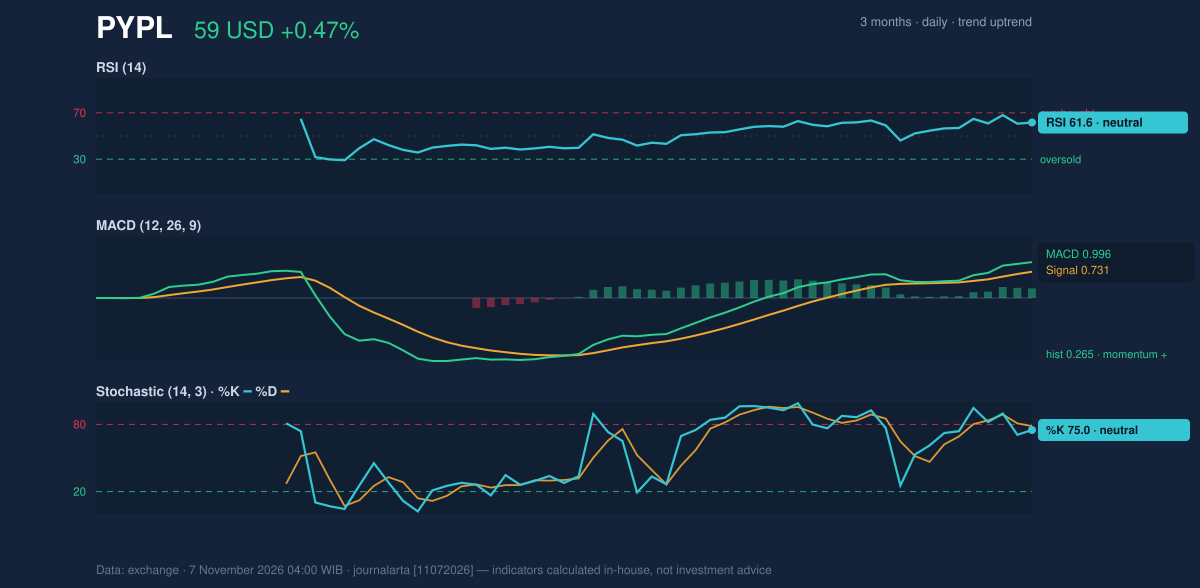
Momentum is positive but not decisive. MACD is 0.996 against a 0.731 signal line, with a positive 0.265 histogram. RSI is 61.6, classed as neutral, and stochastic readings of 75.0 and 78.5 are also neutral. RSI rolling over from above 65 is a cautionary signal. The latest volume, 7,440,300 shares, was 0.6 times its 20-session average of 11,595,505, while OBV is rising. ATR of $1.64, or 2.8% of price, points to moderate volatility.
Momentum chart of PYPL: RSI(14), MACD, Stochastic.Bullish scenario: a break above the $60.20 20-day resistance would put the three-month high of $62.73 in focus. Positive MACD and rising OBV support this case, though neither guarantees follow-through.
Bearish scenario: a fall below $54.99 would break 20-day support and weaken the current structure; the lower Bollinger band at $54.74 is another nearby reference. A decline below the 20-day average at $57.23 would be an earlier warning, not confirmation of a break in support.
Fundamentals and Catalysts
PayPal reported revenue of $8.58 billion for the quarter ended September 30, up 2.0% from $8.42 billion a year earlier, according to its Form 10-Q filed October 27. Net income fell to $1.07 billion from $1.25 billion, while diluted earnings per share were $1.25. The filing gives investors a mixed picture: revenue expanded, but earnings were lower year over year.
In third-quarter results, basic earnings per share from continuing operations were $1.26, slightly below the $1.31 figure used for comparison, according to information published November 7. That earnings detail may matter alongside the modest revenue growth as investors assess the company’s operating performance.
PayPal filed a Form 8-K with the U.S. Securities and Exchange Commission on October 27 reporting its results of operations and financial condition. The company and four current and former executives also asked a federal judge to dismiss a securities-fraud lawsuit concerning branded checkout growth, according to information published November 7. The litigation introduces a company-specific uncertainty, although the filing itself does not establish how the case will be resolved.
Advertisement
Macro, Political and Global Factors
The supplied research contains no dated macroeconomic, political or global developments relevant to PayPal. The November 9–13 analysis therefore rests on the company disclosures and market indicators above, rather than assumptions about policy or the wider economy.
Risks and What Would Invalidate the Scenario
The neutral technical bias reflects a balance: the share price is above rising moving averages and OBV is increasing, but only two of seven signals are bullish, while RSI rolling over from above 65 is a bearish signal. Low latest-session volume also means the move toward resistance lacks confirmation from heavier trading.
A close above $60.20 would clear the nearest resistance and bring $62.73 into view; a break below $54.99 would invalidate the support-based bullish scenario. Between those levels, the $57.23 SMA20 and $54.74 lower Bollinger band are additional reference points. Company risks include lower quarterly net income and the lawsuit over branded checkout growth, as reported October 27 and November 7, respectively.
Advertisement
Technical Verdict for the Week: HOLD
HOLD (wait & see) fits the neutral technical bias. The price remains above the rising SMA20 and SMA50; MACD is positive at 0.996 versus a 0.731 signal; and OBV is rising. Against that, RSI at 61.6 is neutral and has rolled over from above 65, while the stock is close to $60.20 resistance.
- Entry range: $57.23 (SMA20) to $60.20 (20-day resistance)
- Target price: $62.73 (three-month high, if price clears $60.20)
- Stop loss: $54.99 (20-day support)
- Invalidation: the bullish case is invalidated if price breaks below $54.99.
For non-traders, the chart is constructive but lacks enough confirmation to resolve the balance between support and resistance.
PYPL Week Ahead Data
Trading week
November 2 – November 6 (5 sessions)
Weekly change
3.91% (57.01 → 59.24 USD)
Week high / low
60.87 (November 4) / 57.26 (November 2)
Best / worst session
3.42% (November 4) / -2.06% (November 5)
Avg daily volume vs prior 20 sessions
10,873,080 vs 11,471,925 (0.95x)
SMA20 / SMA50
57.23 / 55.10
RSI (14) / Stochastic %K
61.6 / 75.0
Support / Resistance 20 days
54.99 / 60.20
3-month high / low
62.73 / 50.80
Week covered
November 9–13, 2026
Data as of
7 November 2026 04:00 WIB
Advertisement
Disclaimer: This technical analysis is generated automatically from exchange data and indicators calculated by JournalArta, for information and education only. The verdict and the entry, target and stop-loss levels are not investment advice or a solicitation to buy or sell any security. Investment decisions and their risks rest solely with the reader.