Tencent Stock Week Ahead: Levels and Scenarios for November 9–13
Tencent stock week ahead for November 9–13: last close 419.80 HKD, weekly change 9.44%, support 377.60, resistance 430.40.
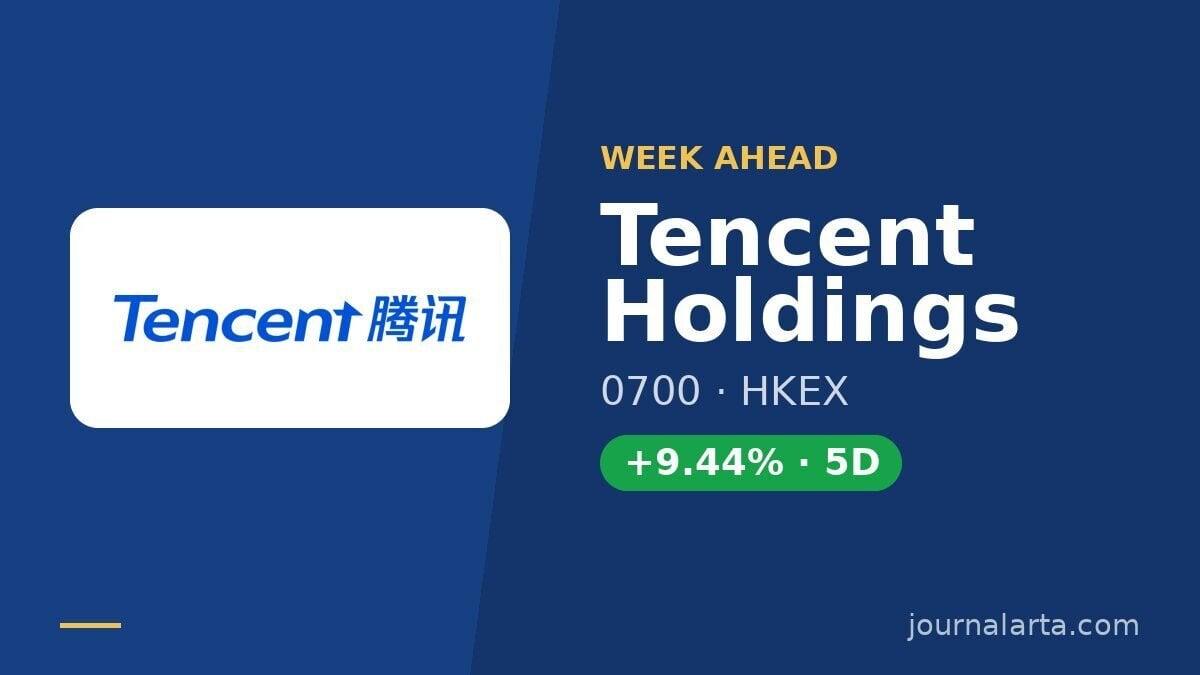
Tencent shares finished the week at HK$419.80, up 9.44% across the five Hong Kong sessions through November 6, but ended with a pullback that leaves the stock just below its 50-day moving average. That mix of a strong weekly rebound and a more cautious final session sets up a test of whether momentum can carry into November 9–13.
Last Week in Review
The best session was November 5, when shares gained 7.17%; the weakest was November 6, down 2.46%. Four sessions rose and one fell.
Trading was active: average daily volume reached 29,554,296 shares, or 1.37 times the average across the preceding 20 sessions. The rally therefore came with heavier-than-usual participation, though the final-day decline shows that sellers returned near the week’s high.
Technical Map for the Week Ahead
The chart’s near-term reference points are support at HK$377.60 and resistance at HK$430.40, the 20-session levels. The three-month range extends from HK$375.20 to HK$491.00. Tencent closed above its 20-day moving average (SMA20), at HK$403.45, but slightly below the 50-day average (SMA50), at HK$421.90. A moving average smooths price action to show the broader trend; the SMA20’s slope is negative at 0.78% over five days, while no new moving-average crossover has formed.
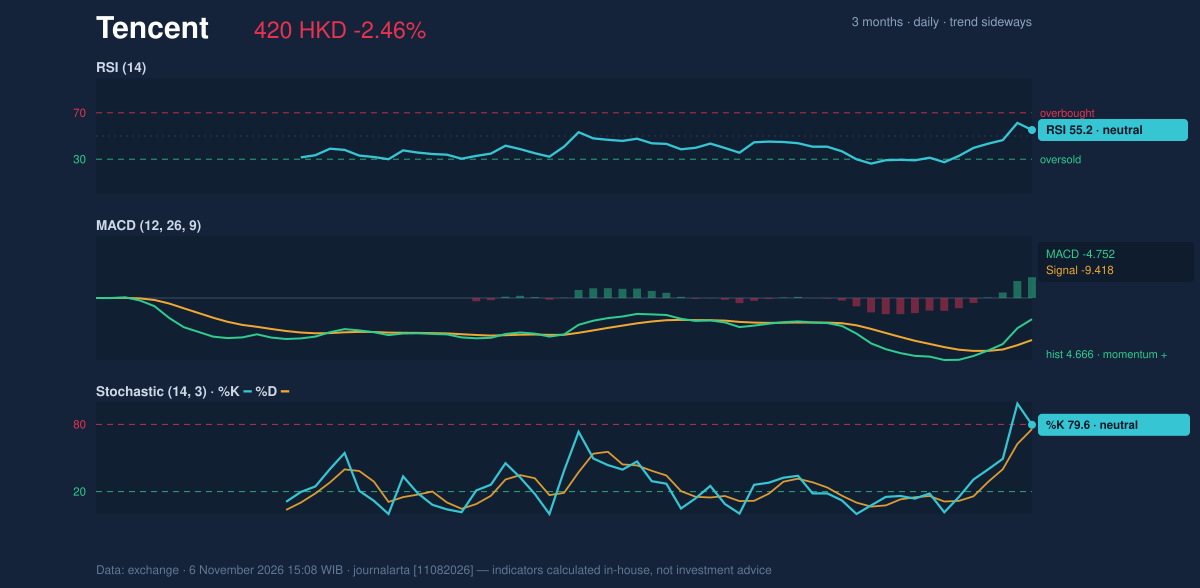
The momentum readings are mixed rather than decisive. RSI, a measure of the pace of recent gains and losses, is neutral at 55.2; stochastic readings are also neutral, at 79.6 for %K and 75.8 for %D. MACD momentum is positive, with a histogram of 4.666, while the MACD itself remains below zero at -4.752. Bollinger bands—an indicator of price movement relative to recent volatility—span HK$368.16 to HK$438.74, with the middle band at HK$403.45. The stock is at 73% of the band’s width, which is normal at 17.5%.
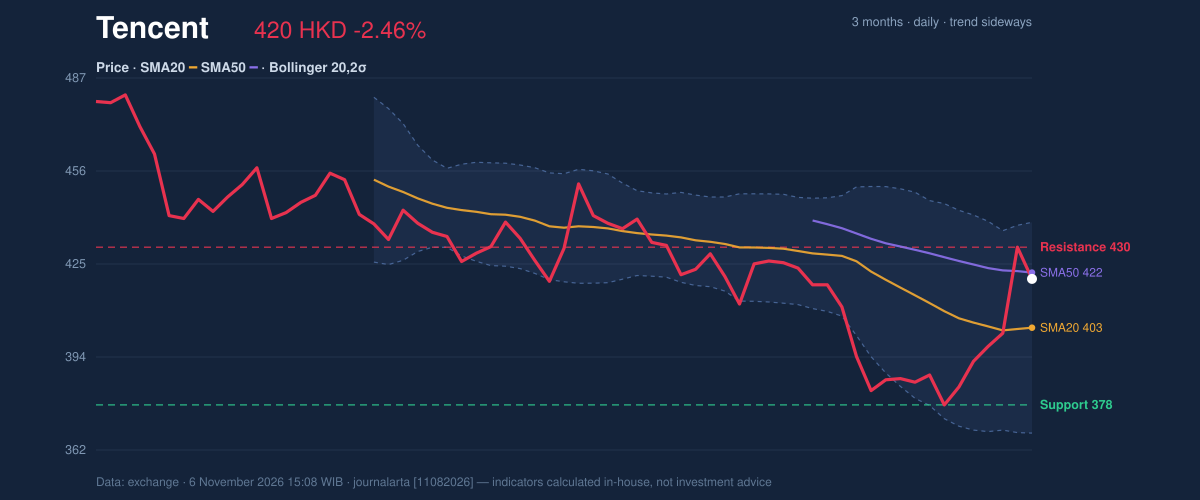
The price chart shows the immediate contest between the November 5 high and the 20-day resistance. Volume on the latest session was 1.2 times its 20-session average, and on-balance volume was rising, a sign that cumulative trading volume has favored buying pressure.
Bullish scenario: a break above HK$430.40 would clear 20-day resistance and put the upper Bollinger band at HK$438.74 in view as the next technical reference. A sustained move above that band would be a further test of the rebound, not confirmation on its own.
Bearish scenario: a fall below the 20-day average at HK$403.45 would weaken the near-term structure; the more consequential reference is support at HK$377.60. The coded technical bias remains neutral: one of seven bullish signals and one of seven bearish signals.
Fundamentals and Catalysts
Tencent’s cash-generating capacity is in focus after a sharp share-price reset this year, according to a report published on November 4. The report framed the question around whether cash the business can generate over time supports the then-current HK$401.60 level. That figure is a dated reference from the report, not the latest close.
Also reported on November 4, fresh headlines concerned access to AI infrastructure and new payment partnerships. Their potential importance lies in how those developments could affect expectations for Tencent’s future cash flows; the available information does not specify financial terms or a scheduled company event.
Macro, Political and Global Factors
The research supplied no dated macroeconomic, political or global developments relevant to Tencent. There is therefore no additional policy or cross-market catalyst to incorporate into the November 9–13 technical map.
Risks and What Would Invalidate the Scenario
The rebound could lose traction if the stock fails to reclaim SMA50 at HK$421.90 or is rejected at HK$430.40. Conversely, a move below SMA20 at HK$403.45 would put the recovery under pressure, with HK$377.60 marking the 20-day support level. The technical bias is neutral, not a confirmed trend reversal: RSI is neutral at 55.2, and price remains below SMA50.
Fundamental uncertainty is also present. A report published on November 4 said Tencent was down 35.5% year to date, raising questions about the durability and growth profile of future cash flows. The same report’s discussion of AI infrastructure access and payment partnerships offers context, but no quantified impact that would settle those questions.
Technical Verdict for the Week: HOLD
HOLD (wait & see) matches the neutral technical bias. Three readings argue for patience: RSI is neutral at 55.2; the stock is above SMA20 at HK$403.45 but below SMA50 at HK$421.90; and MACD’s positive 4.666 histogram contrasts with a MACD line still below zero at -4.752. The verdict is invalidated if price falls below HK$377.60, the 20-day support.
- Entry range: HK$403.45–HK$430.40, bounded by SMA20 and 20-day resistance.
- Target reference: HK$430.40, the 20-day resistance.
- Risk reference: HK$400.60, price minus 1.5 times ATR.
In plain English, the chart has improved, but it has not yet resolved whether buyers can overcome nearby resistance.
Tencent Week Ahead Data
| Trading week | November 2 – November 6 (5 sessions) |
| Weekly change | 9.44% (383.60 → 419.80 HKD) |
| Week high / low | 431.20 (November 5) / 384.60 (November 2) |
| Best / worst session | 7.17% (November 5) / -2.46% (November 6) |
| Avg daily volume vs prior 20 sessions | 29,554,296 vs 21,586,305 (1.37x) |
| SMA20 / SMA50 | 403.45 / 421.90 |
| RSI (14) / Stochastic %K | 55.2 / 79.6 |
| Support / Resistance 20 days | 377.60 / 430.40 |
| 3-month high / low | 491.00 / 375.20 |
| Week covered | November 9–13, 2026 |
| Data as of | 6 November 2026 15:08 WIB |
Disclaimer: This technical analysis is generated automatically from exchange data and indicators calculated by JournalArta, for information and education only. The verdict and the entry, target and stop-loss levels are not investment advice or a solicitation to buy or sell any security. Investment decisions and their risks rest solely with the reader.
Track Tencent share price daily: live levels, support/resistance and our full Tencent analysis history.