XOM Stock Week Ahead: Technical Outlook for November 9–13
XOM stock week ahead for November 9–13: last close 165.87 USD, weekly change -11.42%, support 165.30, resistance 187.25.
By Alistair Sterling
November 7, 20265 min read
Advertisement
Logo ExxonMobil — JournalArta illustration
Last Week in Review
ExxonMobil fell 11.42% in the week ended November 6, closing at $165.87 after opening the first session at $183.98. The retreat left the stock near the bottom of its weekly range, with Friday’s close just 11% above the week’s low.
The move was sharp. XOM traded between a high of $184.59 on November 2 and a low of $163.51 on November 6, a weekly range of 12.89%. Friday was the strongest session, up 0.34%, but only one session advanced; November 4 was the weakest, down 4.62%. Average daily volume reached 17,671,040 shares, or 1.47 times the average for the preceding 20 sessions, indicating heavier trading during the decline.
Technical Map for the Week Ahead
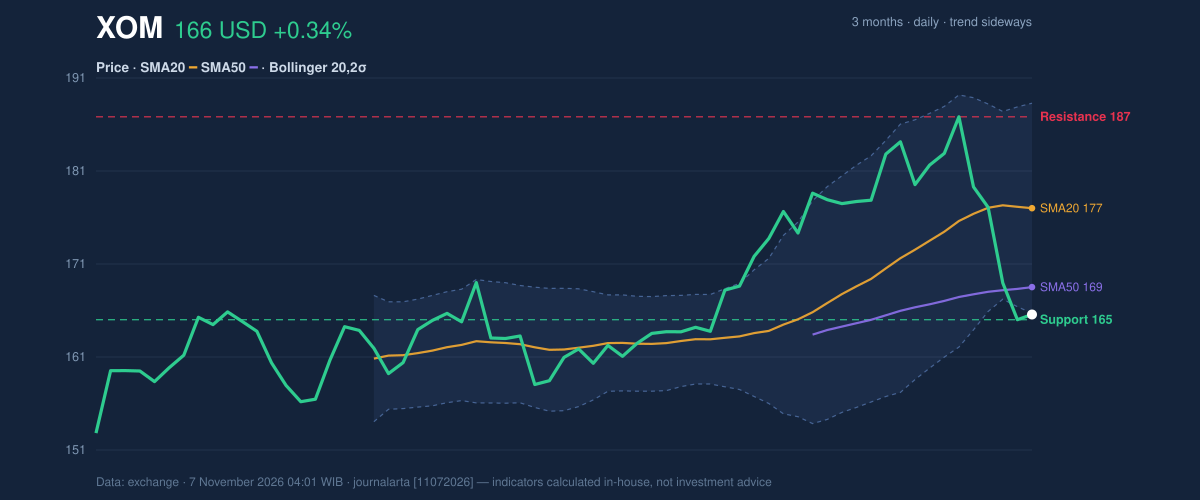
XOM enters the November 9–13 week at $165.87, below its 20-day moving average of $177.36 and its 50-day average of $168.82. The nearest 20-day support is $165.30, with resistance at $187.25. The three-month range runs from $151.53 to $188.50.
The close was also just below the lower Bollinger Band at $166.00. Bollinger Bands track price relative to a moving average and recent volatility; a close beneath the lower band can signal pronounced short-term pressure, but does not by itself establish that a rebound is due. The band’s middle line is $177.36 and its width is 12.8%, described as normal.
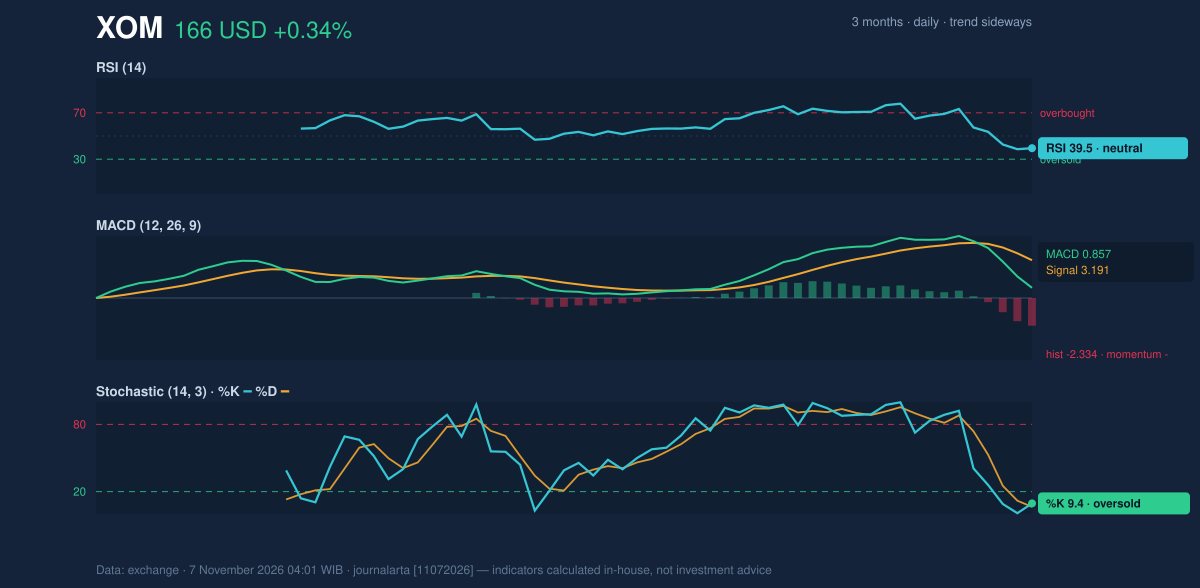
Momentum readings are mixed but lean weak. RSI(14), a measure of the pace of recent gains and losses, is 39.5, classified as neutral. Stochastic %K at 9.4 and %D at 6.3 are in oversold territory. MACD is 0.857 against a 3.191 signal line, leaving a negative histogram of -2.334. The 20-day moving average’s slope is positive at 0.78% over five days, while the broader trend is classified as sideways. The technical-bias model is neutral, with no bullish signals out of seven and one bearish signal out of seven: RSI rolling over from above 65.
The price chart marks the closely watched support and the wider three-month range.
3-month price action chart of XOM: price, SMA20/50, Bollinger, support & resistance.
Advertisement
The momentum chart shows oversold stochastic readings alongside negative MACD momentum.
Momentum chart of XOM: RSI(14), MACD, Stochastic.BULLISH SCENARIO: A recovery that holds above $165.30 and reclaims the 50-day average at $168.82 would provide early evidence that selling pressure is easing. A break above the DATA’s 20-day resistance at $187.25 would be the clearer bullish trigger, with the three-month high at $188.50 the next reference level.
BEARISH SCENARIO: A break below $165.30 would put the three-month low of $151.53 in view as the next major support reference. The DATA also places price minus 1.5 times ATR at $158.08. ATR, or average true range, measures recent price movement; its $5.20 reading, equal to 3.1% of the stock price, points to moderate volatility.
Fundamentals and Catalysts
ExxonMobil reported quarterly revenue of $113.16 billion for the quarter ended September 30, up 32.7% from $85.29 billion a year earlier, according to its Form 10-Q filed on November 2. Net income was $15.41 billion, compared with $7.55 billion a year earlier, and diluted earnings per share were $3.72, also reported on November 2. Those results provide a strong earnings backdrop, but the share-price decline shows that published results have not prevented near-term technical weakness.
The company filed a Form 8-K with the U.S. Securities and Exchange Commission on October 30, reporting results of operations and financial condition and a Regulation FD disclosure. A separate company item published November 3 put XOM’s trailing 12-month EV/EBITDA at 8.59 times, compared with a broader industry average of 6.66 times. EV/EBITDA compares enterprise value with earnings before interest, taxes, depreciation and amortization; the reported premium is a valuation consideration, not a price signal.
Advertisement
Macro, Political and Global Factors
The research block provides no verified, dated macroeconomic, political or global facts for this week. No additional policy or commodity-market catalyst is therefore included here.
Risks and What Would Invalidate the Scenario
The immediate technical risk is a failure to hold $165.30, the 20-day support reference, after the stock closed at $165.87 and below the lower Bollinger Band. A break beneath support would weaken the case for a stabilization and bring $158.08 and then the three-month low of $151.53 into focus. Conversely, a sustained recovery above $168.82 would improve the short-term picture, though the $177.36 20-day average and $187.25 resistance remain hurdles.
Heavy volume during last week’s decline and falling OBV—a volume-based measure of buying and selling pressure—are further signs that selling has been broad enough to merit attention. Oversold stochastic readings could ease if the stock stabilizes, but negative MACD momentum and the close below both moving averages keep the technical picture from turning constructive on those readings alone.
Advertisement
Technical Verdict for the Week: HOLD
The neutral technical bias supports a HOLD (wait & see) verdict. RSI(14) at 39.5 is neutral rather than deeply weak; stochastic readings of 9.4 and 6.3 show oversold conditions; and the 20-day moving average has a positive 0.78% five-day slope. Against that, XOM is below its 20-day and 50-day averages, while the MACD histogram is negative at -2.334.
- Entry range: $165.30–$168.82, using 20-day support and the 50-day moving average as reference levels.
- Target price: $177.36, the 20-day moving average.
- Stop loss: $158.08, the price-minus-1.5-times-ATR reference level.
The verdict is invalidated if price breaks below $165.30, the 20-day support. In plain English, the chart is mixed, so the next move needs confirmation before the technical picture becomes clearer.
XOM Week Ahead Data
Trading week
November 2 – November 6 (5 sessions)
Weekly change
-11.42% (187.25 → 165.87 USD)
Week high / low
184.59 (November 2) / 163.51 (November 6)
Best / worst session
0.34% (November 6) / -4.62% (November 4)
Avg daily volume vs prior 20 sessions
17,671,040 vs 12,023,615 (1.47x)
SMA20 / SMA50
177.36 / 168.82
RSI (14) / Stochastic %K
39.5 / 9.4
Support / Resistance 20 days
165.30 / 187.25
3-month high / low
188.50 / 151.53
Week covered
November 9–13, 2026
Data as of
7 November 2026 04:01 WIB
Advertisement
Disclaimer: This technical analysis is generated automatically from exchange data and indicators calculated by JournalArta, for information and education only. The verdict and the entry, target and stop-loss levels are not investment advice or a solicitation to buy or sell any security. Investment decisions and their risks rest solely with the reader.