XOM Stock Gains 4.47% Today, Testing Key Resistance
Technical analysis of XOM stock on Juli 15, 2026: price 145.09 USD, trend sideways, RSI 55.1, support 136.06, resistance 147.01. Key angle: XOM Stock Gains.

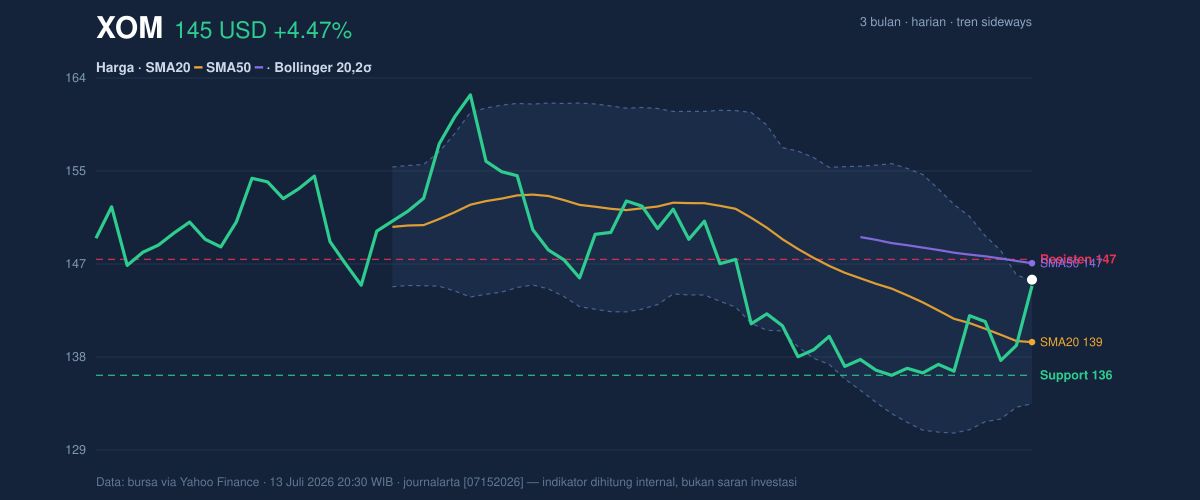
ExxonMobil (XOM) shares surged by 4.47% to close at 145.09 USD on the New York Stock Exchange, signaling a decisive shift in market sentiment following recent sessions of consolidation. This aggressive move has pushed the energy giant back above its 20-day Simple Moving Average (SMA) of 139.19 USD, effectively testing the ceiling of its recent trading range. Investors are closely monitoring whether this breakout is fueled by fundamental shifts in energy demand or simply a technical snap-back from the lower bounds of the three-month trading cycle, which bottomed near 134.95 USD.
Price Structure and Trend Dynamics
The stock currently sits in a precarious position relative to its major moving averages. While the price has reclaimed the 139.19 USD SMA20 support, it remains tethered just below the 146.65 USD SMA50, which continues to act as a significant psychological and technical overhead hurdle. The slope of the SMA20, currently tilted at -1.56%, reflects the recent period of sideways indecision that has characterized the stock over the past month. However, the breakout above the Bollinger upper band—evidenced by a %B reading of 101%—suggests that buyers are exerting extreme short-term pressure, pushing the asset into "stretched" territory.
Momentum and Oscillators
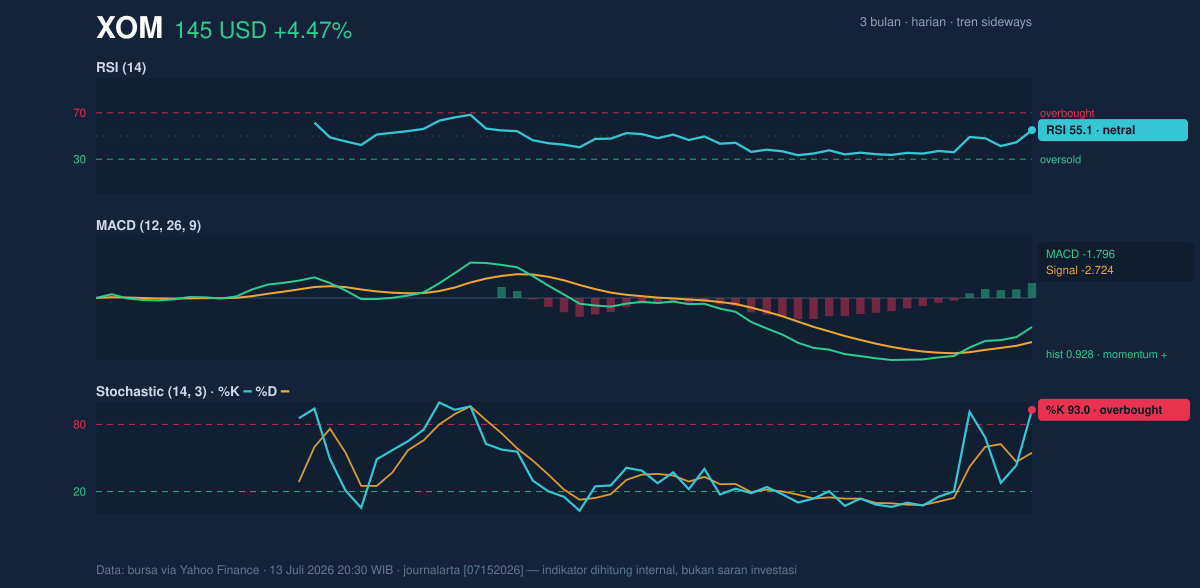
The divergence between the price action and momentum indicators provides a complex narrative for market participants. The MACD line at -1.796 is currently resting above its signal line of -2.724, producing a positive histogram of 0.928, which confirms that internal momentum is shifting toward the buyers. Conversely, the Stochastic oscillator at 93.0 sits deep in overbought territory, implying that the pace of the recent rally may be unsustainable without a brief period of cooling off. Despite the Stochastic signals, the RSI at 55.1 remains firmly in neutral ground, suggesting that the current buying frenzy has not yet exhausted the broader trend’s potential for growth.
Volume and Volatility
Trading volume has mirrored the price action, with 18,724,300 shares traded, representing exactly 1.0x the 20-day average volume. This alignment indicates that the move is supported by genuine market participation rather than a liquidity-driven anomaly. The On-Balance Volume (OBV) is trending upward, suggesting that institutional players are actively accumulating during this leg of the move. With an Average True Range (ATR) of 3.04 USD, the stock is exhibiting moderate volatility, moving roughly 2.1% of its value daily. This level of volatility suggests that while the move is significant, it remains within a manageable range for risk management strategies.
Key Levels and Conditional Scenarios
The battle for control is currently centered on the 147.01 USD resistance level. Should XOM sustain its current momentum and break decisively through this ceiling, it could clear the path to test higher values not seen since the three-month high of 163.68 USD. Conversely, a failure to hold the 139.19 USD support—the current SMA20—would likely invite a retest of the lower Bollinger band boundary near 133.37 USD, effectively neutralizing the recent gains.
Technical Verdict: HOLD (wait & see)
* Verdict Reasoning: The asset is currently hitting the upper Bollinger band limit while simultaneously entering overbought conditions on the Stochastic oscillator, signaling a high risk of a short-term pullback despite positive MACD momentum.
* Invalidation: This outlook is invalidated if the price closes above 147.01 USD with continued high volume, which would negate the overbought warning.
* Parameters:
* Ideal Entry Range: 139.00 USD – 140.00 USD (post-pullback stabilization)
* Exit Target (Resistance): 147.01 USD
* Stop Loss Protection: 136.06 USD (20-day support level)
The stock currently reflects a tug-of-war between strong positive momentum and the mechanical exhaustion of a rapid, single-session price spike. The next company update regarding capital allocation and quarterly production targets is expected to provide the fundamental catalysts necessary to determine if this technical breakout can be sustained beyond the current volatility.
Summary Data XOM
| Last price | 145.09 USD |
| Change 1 day / 5 days / 1 month | 4.47% / 6.34% / -1.03% |
| Trend / MA-cross | sideways / none |
| SMA20 / SMA50 | 139.19 / 146.65 |
| RSI (14) / Stochastic %K | 55.1 / 93.0 |
| Bollinger %B / ATR | 101% / 3.04 |
| Support / Resistance 20 days | 136.06 / 147.01 |
| Data as of | 13 Juli 2026 20:30 WIB |



