ST Engineering Share Price Falls 0.81% on Thursday, RSI Oversold
On November 5, 2026: price 9.80 SGD, trend downtrend, RSI 28.7, support 9.80, resistance 10.42. technical analysis of st engineering stock.
Why ST Engineering is in focus today
- Volume at 1.7× the 20-day average
- Closed at a 20-day low (9.80)
- Trading near its 3-month low (9.63)
- RSI(14) at 28.7 — oversold zone
- Breaking out of a Bollinger squeeze (band width 7.7%)
- Downtrend extending (5-day change -3.35%)
Selected automatically from 32 SGX (Singapore) stocks by a technical-signal score with daily weighted randomisation — not a recommendation.
Trend & Price Action
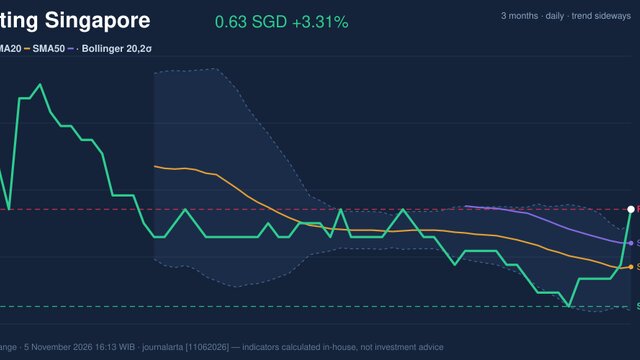
The session’s close at S$9.80 was at the bottom of the 20-day trading range, with resistance at S$10.42. The lower Bollinger Band stood at S$9.81, putting the close just beneath it. Bollinger Bands track price dispersion around a moving average; a close below the lower band indicates unusually weak action relative to recent trading, though it does not by itself establish how long the decline will continue. The squeeze has resolved to the downside, not the upside. The band width was 7.7%, and the supplied technical assessment identifies a downside break from the narrowing pattern. The stock also sits close to the three-month low, rather than midway through its broader range.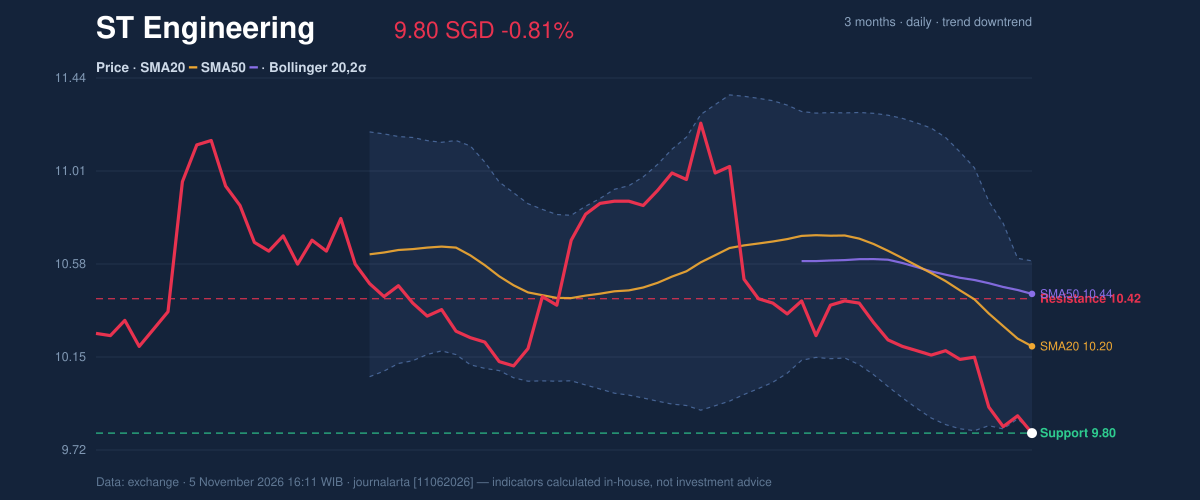
Momentum & Volatility
RSI at 28.7 and Stochastic readings of 19.5 (%K) and 18.7 (%D) are in oversold territory. These indicators measure the pace of recent price moves; low readings can mean selling has become stretched, but they do not confirm that a reversal has started. Here, the MACD remains negative at -0.185, below its -0.140 signal line, with a negative histogram of -0.045. That keeps the momentum evidence tilted toward continued weakness rather than a confirmed turn.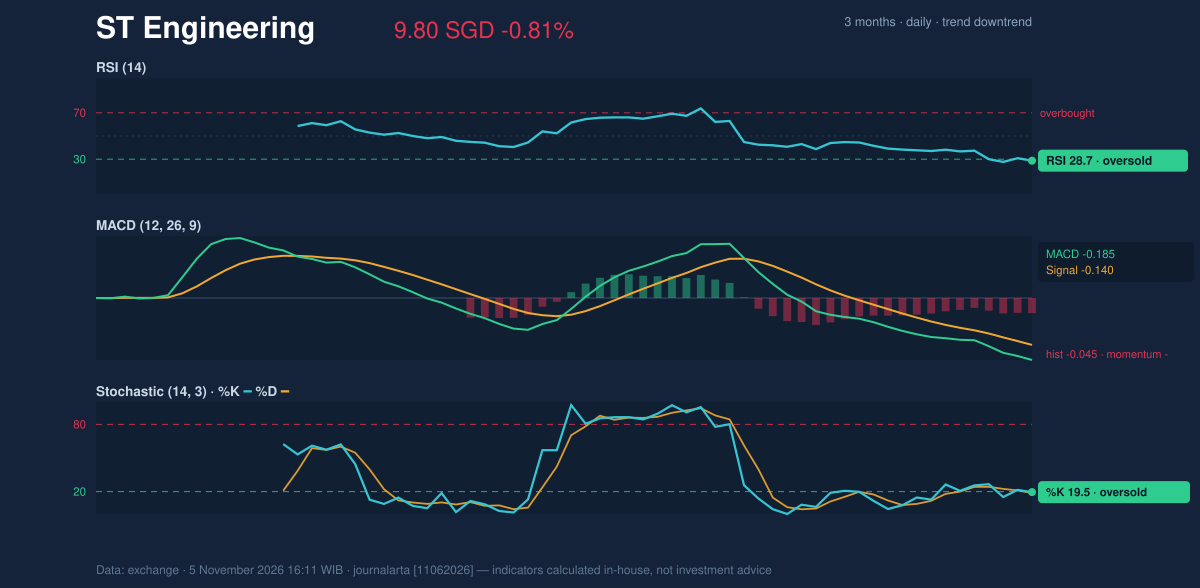
Key Levels & Scenarios
At S$9.80, the shares were at the 20-day support level and at the bottom of the stated 20-day range. A move below that level would put the three-month low of S$9.63 in focus. The supplied reference level at S$9.48, calculated as the price minus 1.5 times ATR, offers another downside marker, but it is not a guaranteed floor. On the upside, S$10.12 is the price-plus-1.5-times-ATR reference level. Beyond it, S$10.20—the 20-day average—and S$10.42 resistance are hurdles that would need to be reclaimed to ease the immediate technical pressure. A move back above the lower Bollinger Band would be an initial improvement, but stronger evidence would require price recovery alongside a turn in momentum and OBV.Technical Verdict: SELL
The technical bias is bearish, with three of seven assessed signals bearish and none bullish. The strongest evidence is the close at the 20-day low on volume 1.7 times average, the downside resolution of the Bollinger squeeze, and falling OBV. Oversold RSI and Stochastic readings warn that a rebound is possible, but neither cancels the negative MACD or the broader downtrend. - Entry reference range: S$9.80–S$10.42, spanning 20-day support and resistance. - Exit target: S$9.63, the three-month low; S$9.48 is the lower 1.5-times-ATR reference. - Stop-loss protection reference: S$10.42, above the 20-day resistance level. The bearish view is invalidated if the price breaks above S$10.42. In plain English, the chart still points down, but oversold conditions mean the decline could pause or rebound before the trend is settled. Data: Singapore Technologies Engineering market and technical indicators for the Thursday, November 5, 2026 session; levels and signals are attributed to the supplied exchange-market data.Summary Data ST Engineering
| Last price | 9.80 SGD |
| Change 1 day / 5 days / 1 month | -0.81% / -3.35% / -6.76% |
| Trend / MA-cross | downtrend / none |
| SMA20 / SMA50 | 10.20 / 10.44 |
| RSI (14) / Stochastic %K | 28.7 / 19.5 |
| Bollinger %B / ATR | -1% / 0.21 |
| Support / Resistance 20 days | 9.80 / 10.42 |
| Data as of | 5 November 2026 16:11 WIB |
Disclaimer: This technical analysis is generated automatically from exchange data and indicators calculated by JournalArta, for information and education only. The verdict and the entry, target and stop-loss levels are not investment advice or a solicitation to buy or sell any security. Investment decisions and their risks rest solely with the reader.
Track ST Engineering share price daily: live levels, support/resistance and our full ST Engineering analysis history.