NetEase Stock Gains 9.07%, Golden Cross Formed In Focus
On November 5, 2026: price 199.60 HKD, trend sideways, RSI 62.5, support 172.40, resistance 199.60. technical analysis of netease stock.
Trend & Price Action
NetEase closed above its 20-day and 50-day averages, at HK$187.58 and HK$187.30 respectively. The golden cross formed on the latest session, putting a short-term trend signal behind the rally. The stock also finished at its 20-day resistance of HK$199.60, or the top of its recent range. A close at resistance can reflect strong demand, but it also leaves little room before the next chart-defined hurdle. The immediate test is whether the breakout can hold above HK$199.60. The three-month high at HK$210.60 is the next major resistance level in the supplied data. The three-month low is HK$171.50, while 20-day support sits at HK$172.40.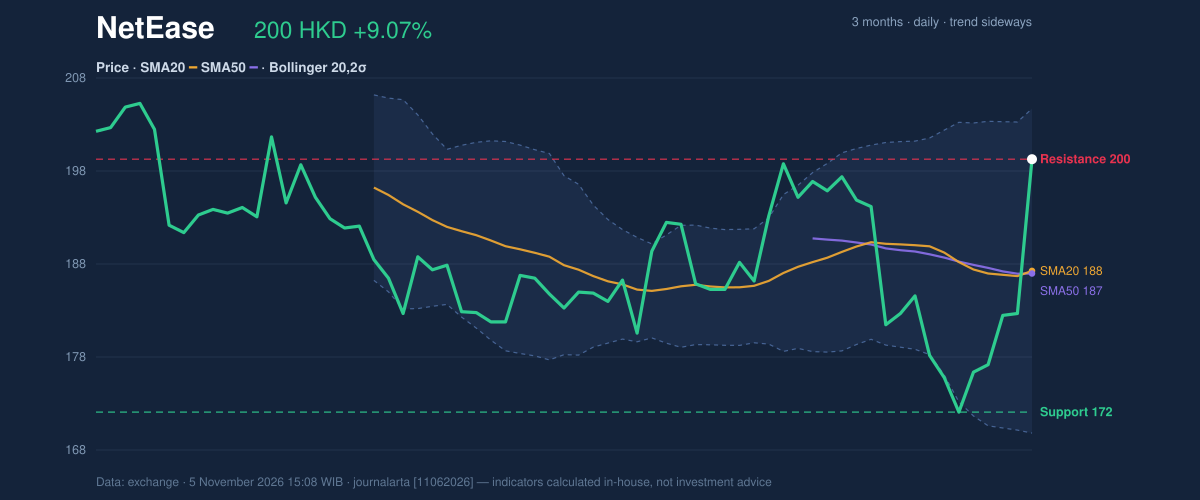
Oscillators & Momentum
Momentum indicators broadly improved, but they are not sending identical messages. The Relative Strength Index (RSI), a measure of recent price strength, stands at 62.5, in neutral territory. The Stochastic oscillator, which compares a close with the recent trading range, is overbought at %K 92.7 and %D 56.0. That reading signals a fast advance that could pause or pull back; it does not, on its own, establish that the trend has reversed. The MACD histogram has turned positive at 0.713, with MACD at -1.307 above its -2.020 signal line. This indicates improving momentum, though MACD itself remains below zero. The combination points to an early strengthening signal rather than an established long-term uptrend. The supplied technical-bias calculation also cites RSI rebounding from below 35; the latest RSI reading is now 62.5. Positive MACD momentum is a confirmation; the overbought Stochastic is the caution.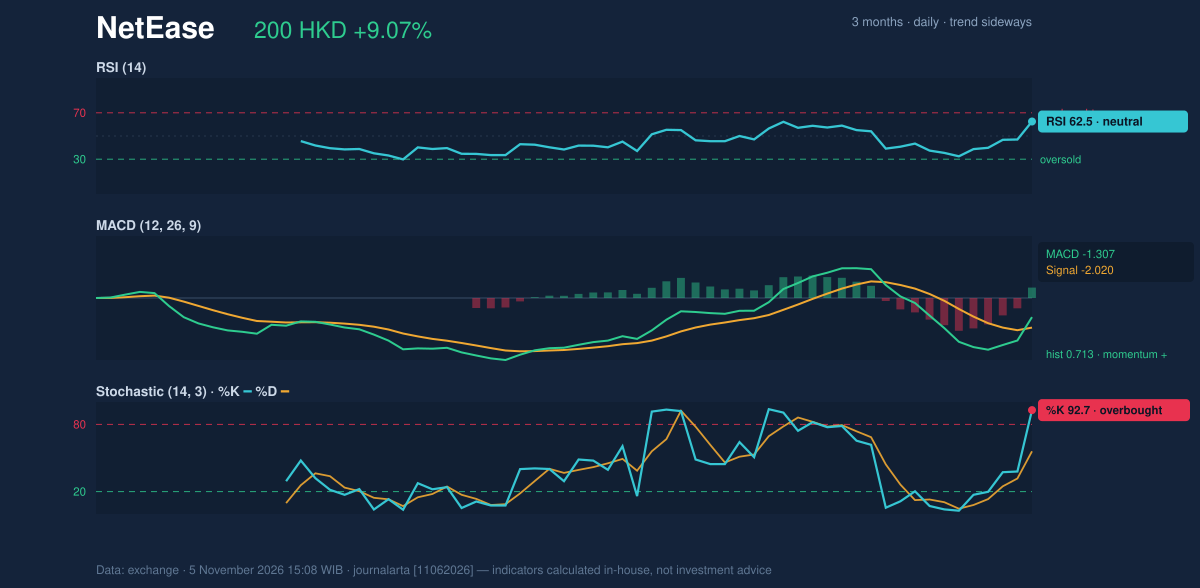
Volatility & Volume
Turnover reached 11,104,064 shares against a 20-day average of 6,687,681, while On-Balance Volume (OBV)—a running measure that adds volume on rising sessions and subtracts it on falling ones—was rising. That supports the view that the advance drew stronger participation, rather than occurring on quiet trading. The daily gain was about 2.5 times the average daily range, based on the supplied comparison with the Average True Range (ATR). ATR was HK$7.17, or 3.6% of the share price, indicating high volatility. Bollinger Bands, which map price against a moving average and its typical variation, were at normal width; the share’s position within the bands was 84%. In other words, price was already near the upper band at HK$205.03, with the middle band at HK$187.58. A further rise may be possible, but the day’s unusually large move raises the risk of wider swings.Technical Verdict: BUY
The technical bias is bullish, supported by the latest-session golden cross, the close above both moving averages on volume 1.7 times its 20-day average, and the MACD histogram turning positive. The counterweight is the overbought Stochastic reading, alongside high ATR volatility and resistance at HK$199.60.- Ideal entry range: HK$187.58–HK$199.60, bounded by the 20-day average and 20-day resistance.
- Exit target: HK$210.60, the next resistance at the three-month high if price moves above HK$199.60.
- Stop-loss protection: HK$172.40, below 20-day support.
Data table — HKEX: 9999.HK
Why NetEase is in focus today
- One-day move of 9.07%, about 2.5× its average daily range (ATR)
- Volume at 1.7× the 20-day average
- Closed at a 20-day high (199.60)
- Fresh golden cross: SMA20 crossed above SMA50
- MACD histogram has just turned positive
Selected automatically from 72 HKEX (Hong Kong) stocks by a technical-signal score with daily weighted randomisation — not a recommendation.
| Last price | HK$199.60 |
| Change | 1 day: 9.07% | 5 days: 15.78% | 1 month: 5.89% |
| 20-day / 50-day averages | HK$187.58 / HK$187.30 |
| RSI / Stochastic | 62.5 / %K 92.7, %D 56.0 |
| MACD / signal / histogram | -1.307 / -2.020 / 0.713 |
| ATR | HK$7.17 (3.6%) |
| Volume / 20-day average | 11,104,064 / 6,687,681 |
| 20-day support / resistance | HK$172.40 / HK$199.60 |
| Three-month low / high | HK$171.50 / HK$210.60 |
Summary Data NetEase
| Last price | 199.60 HKD |
| Change 1 day / 5 days / 1 month | 9.07% / 15.78% / 5.89% |
| Trend / MA-cross | sideways / golden |
| SMA20 / SMA50 | 187.58 / 187.30 |
| RSI (14) / Stochastic %K | 62.5 / 92.7 |
| Bollinger %B / ATR | 84% / 7.17 |
| Support / Resistance 20 days | 172.40 / 199.60 |
| Data as of | 5 November 2026 15:08 WIB |
Disclaimer: This technical analysis is generated automatically from exchange data and indicators calculated by JournalArta, for information and education only. The verdict and the entry, target and stop-loss levels are not investment advice or a solicitation to buy or sell any security. Investment decisions and their risks rest solely with the reader.
Track NetEase share price daily: live levels, support/resistance and our full NetEase analysis history.