OCBC Share Price on Thursday: Rises 0.29%, RSI Oversold
On November 5, 2026: price 27.93 SGD, trend downtrend, RSI 29.3, support 27.85, resistance 29.34. technical analysis of ocbc stock. OCBC Share Price — full…
Trend & Price Action
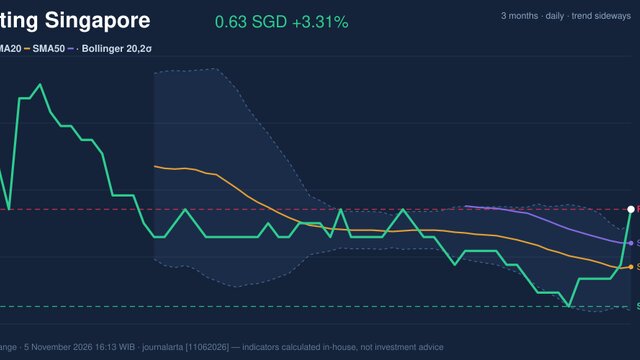
The close remains below both the 20-day moving average at S$28.84 and the 50-day average at S$30.47. The 20-day average fell 2.33% over five days, showing that the near-term trend itself is weakening rather than merely lagging behind a one-session decline. No new moving-average crossover formed in the latest session, so there is no fresh cross signal to suggest the trend has changed. At S$27.93, the share sits close to its 20-day support of S$27.85 and near the bottom of its three-month range, which runs from S$27.22 to S$32.57. The day’s 0.29% gain therefore offers limited evidence of recovery: the five-day loss remains much larger, and the price structure is still below its key averages. As shown in the chart, the close is also just beneath the lower Bollinger band at S$27.95.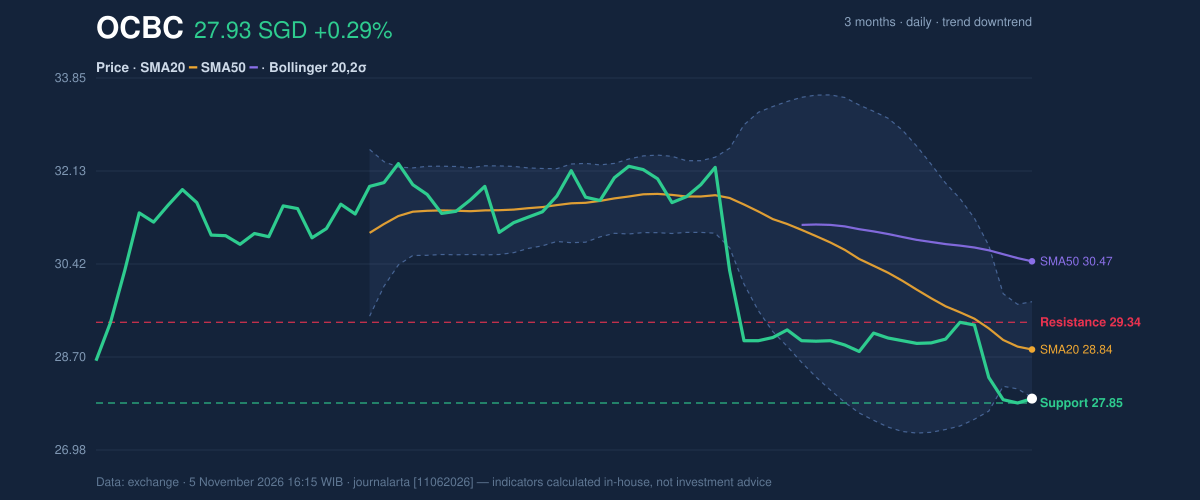
Oscillators & Momentum
The RSI at 29.3 is oversold, a reading that indicates recent losses have been unusually persistent. It can precede a bounce, but it does not establish that selling has run its course. The Stochastic readings, with %K at 28.6 and %D at 25.3, are classified as neutral, offering no strong counter-signal. The MACD remains negative: its reading of -0.639 is below the -0.581 signal line, and the histogram is -0.058. That configuration points to downside momentum rather than a confirmed reversal. Together, the indicators describe an oversold share with momentum still leaning lower—a distinction that matters because a low RSI alone can persist during a downtrend.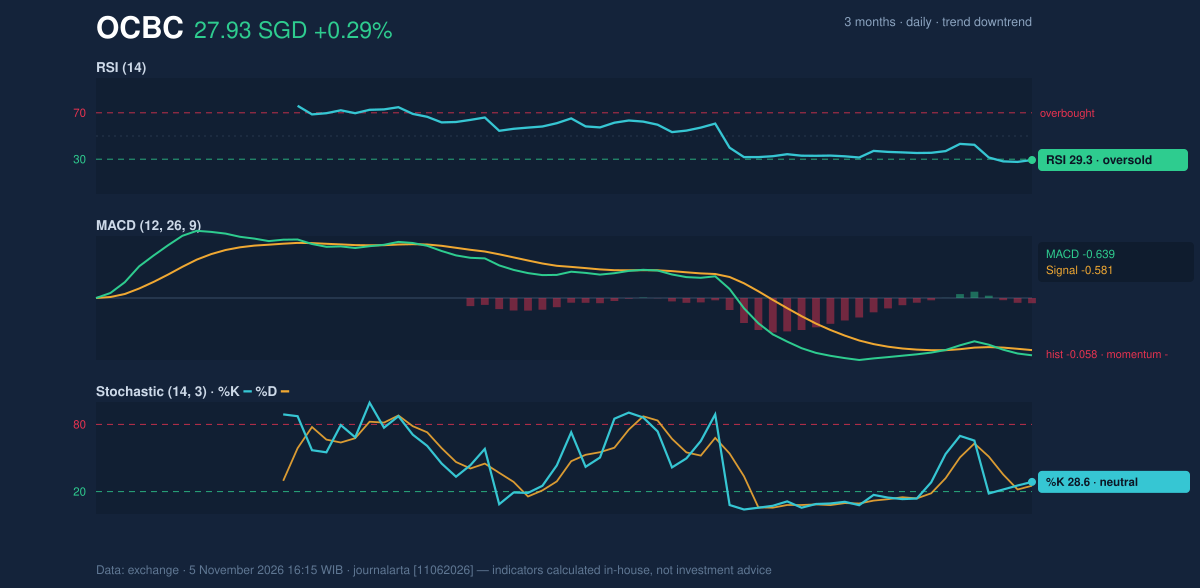
Volatility & Volume
The Bollinger bands have narrowed to a width of 6.1%, a squeeze that signals compressed volatility and the possibility of a larger move as trading ranges expand. Here, the direction of the initial break is unfavorable: the close is below the lower band, with %B at -1%. The band signal therefore reinforces downside pressure rather than pointing to a bullish breakout. Volume was 8,580,900 shares, or 1.3 times the 20-day average of 6,829,657. Higher-than-normal activity gives the move more weight than a decline on thin turnover would have. OBV, a measure of whether volume is accumulating on rising days or distributing on falling days, is also declining. That points to selling participation and weakens the case that the session’s small gain marked a shift in demand. ATR at S$0.58, equal to 2.1% of the share price, indicates moderate daily price variability.Key Levels & Scenarios
The immediate test is S$27.85, the 20-day support. A sustained break below it would put the three-month low at S$27.22 in view; the data’s ATR-based downside reference is S$27.06. If support holds, a recovery would first encounter S$28.80, the ATR-based upside reference, followed by resistance at S$29.34. Clearing that resistance would be needed to challenge the 20-day average, still well above the latest close.Technical Verdict: SELL
The technical bias is bearish, with three bearish signals and no bullish signals. The strongest evidence is the negative MACD histogram, the close below the lower Bollinger band after a squeeze, and falling OBV alongside above-average volume. Oversold RSI is a risk to the bearish case because it leaves room for a short-term rebound, but it is not yet accompanied by positive momentum or improving volume flow. The verdict is invalidated if the price breaks above the 20-day resistance at S$29.34. - Ideal Entry Range: S$27.85–S$28.80, framed by 20-day support and the ATR-based upside reference. - Exit Target (Target Price): S$27.22, the three-month low, after the S$27.85 support gives way. - Stop Loss: S$29.34, the 20-day resistance; the alternative ATR-based level above the price is S$28.80. In plain English, the chart still favors falling prices, though the oversold reading means a rebound remains possible.Data table
Why OCBC is in focus today
- RSI(14) at 29.3 — oversold zone
- Breaking out of a Bollinger squeeze (band width 6.1%)
- Downtrend extending (5-day change -4.81%)
Selected automatically from 32 SGX (Singapore) stocks by a technical-signal score with daily weighted randomisation — not a recommendation.
| Latest close | S$27.93 |
| Daily / five-day / one-month change | +0.29% / -4.81% / -3.69% |
| SMA20 / SMA50 | S$28.84 / S$30.47 |
| RSI / Stochastic | 29.3 / 28.6 (%K), 25.3 (%D) |
| MACD / signal / histogram | -0.639 / -0.581 / -0.058 |
| 20-day support / resistance | S$27.85 / S$29.34 |
| Three-month low / high | S$27.22 / S$32.57 |
Summary Data OCBC
| Last price | 27.93 SGD |
| Change 1 day / 5 days / 1 month | 0.29% / -4.81% / -3.69% |
| Trend / MA-cross | downtrend / none |
| SMA20 / SMA50 | 28.84 / 30.47 |
| RSI (14) / Stochastic %K | 29.3 / 28.6 |
| Bollinger %B / ATR | -1% / 0.58 |
| Support / Resistance 20 days | 27.85 / 29.34 |
| Data as of | 5 November 2026 16:15 WIB |
Disclaimer: This technical analysis is generated automatically from exchange data and indicators calculated by JournalArta, for information and education only. The verdict and the entry, target and stop-loss levels are not investment advice or a solicitation to buy or sell any security. Investment decisions and their risks rest solely with the reader.
Track OCBC share price daily: live levels, support/resistance and our full OCBC analysis history.