Genting Singapore Share Price Technicals: Rises 3.31% on Thursday, Testing Key Resistance
On November 5, 2026: price 0.63 SGD, trend sideways, RSI 66.2, support 0.59, resistance 0.63. technical analysis of genting singapore stock.
Trend & Price Action
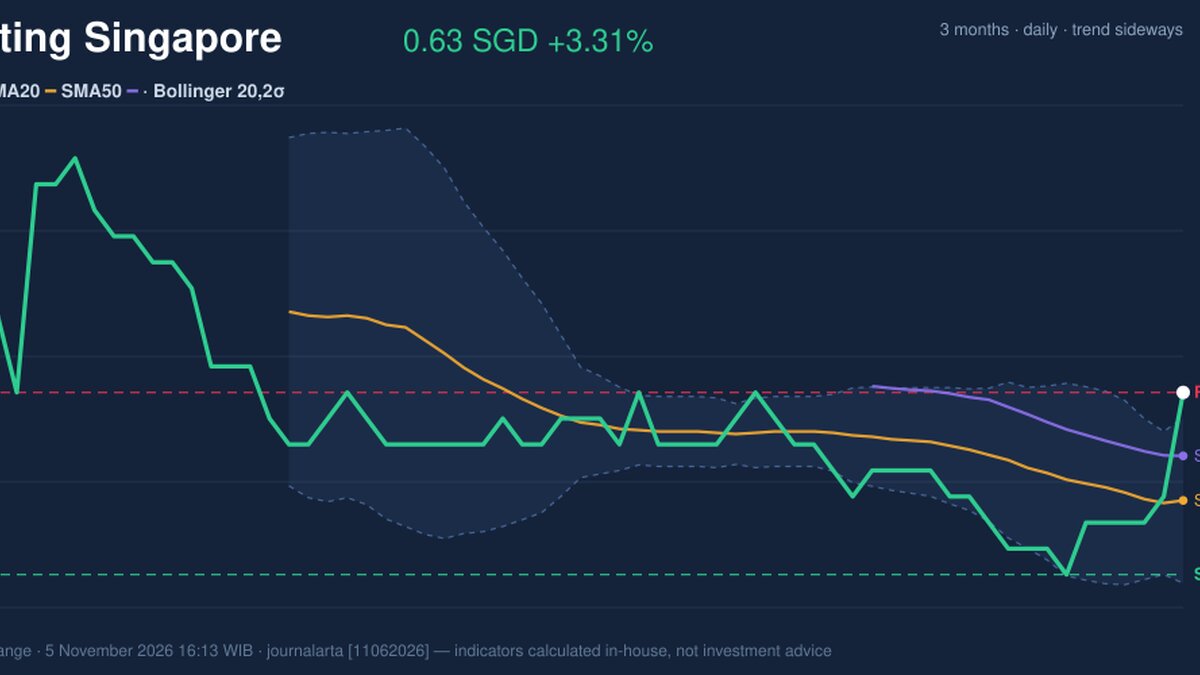
Genting Singapore closed at SGD 0.63 on Thursday, November 5, up 3.31% for the session, as volume surged to 3.5 times its 20-day average and the shares finished at their 20-day high. The combination matters: a price rise on unusually heavy trading suggests broader participation than a move on light volume. The breakout is promising, though it has reached a level where further progress must be proven.
Why Genting Singapore is in focus today
- One-day move of 3.31%, about 1.9× its average daily range (ATR)
- Volume at 3.5× the 20-day average
- Closed at a 20-day high (0.63)
- Breaking out of a Bollinger squeeze (band width 5.3%)
Selected automatically from 32 SGX (Singapore) stocks by a technical-signal score with daily weighted randomisation — not a recommendation.
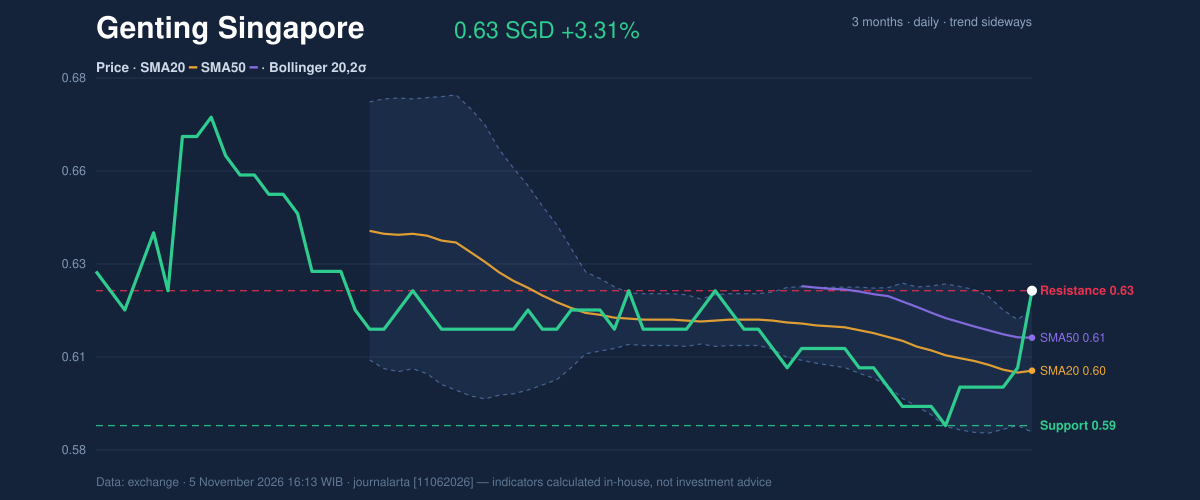
The close was above the 20-day average of SGD 0.60, but the 20-day average itself fell 0.53% over five days. That divergence points to a short-term jump against a still-soft underlying trend, rather than an established upward trend. The 50-day average stood at SGD 0.61, and no new moving-average crossover formed. There is no fresh golden-cross signal to confirm a longer-term change in direction.
The close above the upper Bollinger Band, with the band width at 5.3%, signals a squeeze resolving upward. A squeeze is a period of unusually narrow price bands that can precede a larger move; it indicates potential for movement, not its direction by itself. Here, the upward close and volume add confirmation. As shown in the chart, the price has also reached the 20-day resistance of SGD 0.63, making the next test whether it can hold above that level.
Oscillators & Momentum
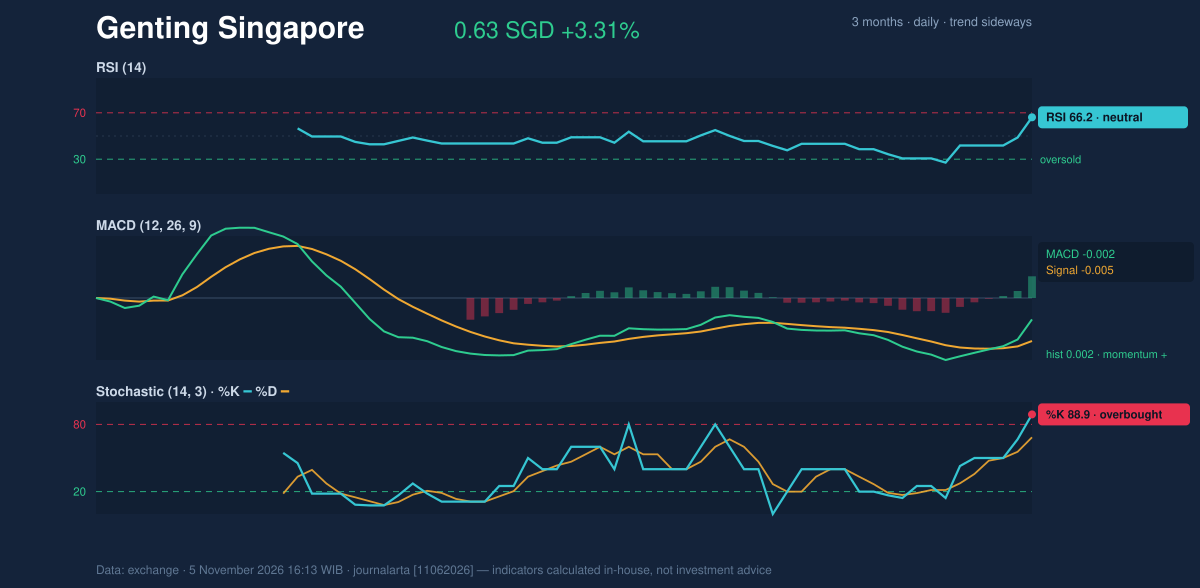
Momentum readings are positive but not uniformly comfortable. MACD momentum has turned positive: its histogram is 0.002, while the MACD line at -0.002 remains below zero. The positive histogram means the recent momentum is improving relative to its signal line; the negative MACD reading cautions that this improvement has not yet shifted the broader indicator above zero.
RSI is 66.2, classified as neutral, while Stochastic is overbought at %K 88.9 and %D 68.5. RSI measures the pace of price gains and has not crossed into the overbought category in this data. Stochastic compares the close with its recent trading range, and its elevated reading suggests the shares may be stretched after the advance. That is a risk of a pause, not proof that a reversal has begun. The chart shows these measures alongside MACD.
Volatility, Volume & Key Levels
Volume reached 72,914,100 shares versus a 20-day average of 20,890,220, while on-balance volume (OBV), a running measure that adds or subtracts volume according to price direction, rose. Together, those readings support the breakout more strongly than price alone. The day’s 3.31% rise was about 1.9 times the average daily range, however, so the move was large relative to recent volatility.
The 14-day average true range (ATR), a measure of typical price movement, was SGD 0.01, or 1.7% of the share price, indicating moderate volatility. The share price was at the top of its 20-day range, with resistance at SGD 0.63 and support at SGD 0.59. The three-month high of SGD 0.68 is the next prominent ceiling if the breakout holds; the three-month low is SGD 0.58. A retreat below SGD 0.63 would weaken the breakout case, while a fall below SGD 0.59 would put the support structure at risk.
Technical Verdict: BUY
The technical bias is bullish, supported by a high-volume close at the 20-day high, a positive MACD histogram and an upward resolution of the Bollinger squeeze. The falling 20-day average and overbought Stochastic are meaningful cautions, but the supplied signals show no bearish signals. The verdict is invalidated if the price falls below the 20-day support at SGD 0.59.
- Ideal entry range: SGD 0.60–0.63, around the 20-day average and the breakout level.
- Exit target: SGD 0.68, the three-month high and next resistance beyond SGD 0.63.
- Stop-loss protection: Below SGD 0.59, the 20-day support.
In plain English, the indicators favor the upward move, but the price needs to stay above support for that reading to remain intact.
Summary Data Genting Singapore
| Last price | 0.63 SGD |
| Change 1 day / 5 days / 1 month | 3.31% / 4.17% / 1.63% |
| Trend / MA-cross | sideways / none |
| SMA20 / SMA50 | 0.60 / 0.61 |
| RSI (14) / Stochastic %K | 66.2 / 88.9 |
| Bollinger %B / ATR | 115% / 0.01 |
| Support / Resistance 20 days | 0.59 / 0.63 |
| Data as of | 5 November 2026 16:13 WIB |
Disclaimer: This technical analysis is generated automatically from exchange data and indicators calculated by JournalArta, for information and education only. The verdict and the entry, target and stop-loss levels are not investment advice or a solicitation to buy or sell any security. Investment decisions and their risks rest solely with the reader.
Track Genting Singapore share price daily: live levels, support/resistance and our full Genting Singapore analysis history.