Xiaomi Stock Technicals: Gains 8.83% on Thursday, RSI Overbought
On November 5, 2026: price 31.30 HKD, trend uptrend, RSI 71.9, support 23.66, resistance 31.30. technical analysis of xiaomi stock. Xiaomi Stock Technicals —…
Why Xiaomi is in focus today
- One-day move of 8.83%, about 2.2× its average daily range (ATR)
- Volume at 2.6× the 20-day average
- Closed at a 20-day high (31.30)
- Trading near its 3-month high (31.40)
- Fresh golden cross: SMA20 crossed above SMA50
- RSI(14) at 71.9 — overbought zone
- Uptrend confirmed (5-day change 21.88%)
- Not covered by JournalArta in the last 14 days
Selected automatically from 72 HKEX (Hong Kong) stocks by a technical-signal score with daily weighted randomisation — not a recommendation.
Trend & Price Action
Xiaomi closed above both its 20-day simple moving average (SMA), at HK$26.64, and its 50-day SMA, at HK$26.55. A golden cross formed in the latest session, meaning the shorter-term average moved above the longer-term one. Such a cross can indicate a shift in trend, though it is more persuasive when prices and trading activity confirm it—as they have here. The 20-day average rose 4.24% over five days, consistent with a rising trend. The shares gained 21.88% over five days and 30.74% over one month, a pace that signals strong demand but also leaves less room for setbacks before the price tests nearby support. At HK$31.30, Xiaomi sits at the top of its 20-day range and close to its three-month high of HK$31.40. The Bollinger upper band, a volatility-based boundary around the moving average, is HK$29.89. The share price has moved above it, with %B at 122%. Trading above the upper band, alongside widening bands, signals unusually strong momentum but also elevated volatility; it is not, on its own, proof that the price must reverse.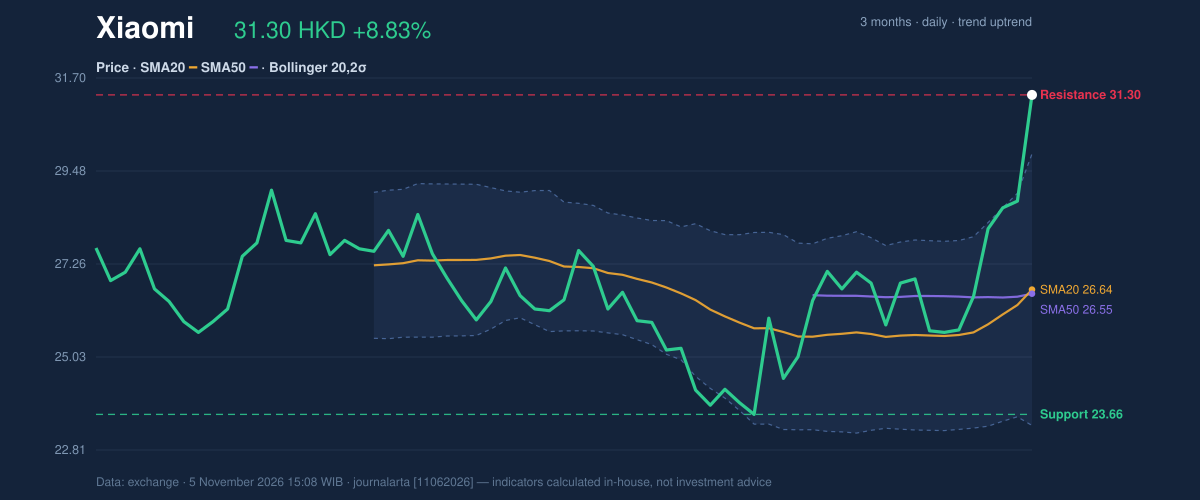
Oscillators & Momentum
Momentum indicators broadly confirm the direction of the move, but warn that it has become extended. RSI is 71.9, in overbought territory; RSI compares recent gains and losses, and a reading above this zone can mean prices have risen faster than their recent pattern would typically sustain. It does not time a reversal by itself. The Stochastic indicator is also overbought: %K is 98.3 and %D is 95.4. These readings place the share near the upper end of its recent trading range. By contrast, MACD—the difference between two trend-following averages—remains positive: MACD is 0.790, above its 0.287 signal line, with a positive 0.504 histogram. That supports the bullish trend, even as the oscillators counsel caution about chasing an already sharp advance.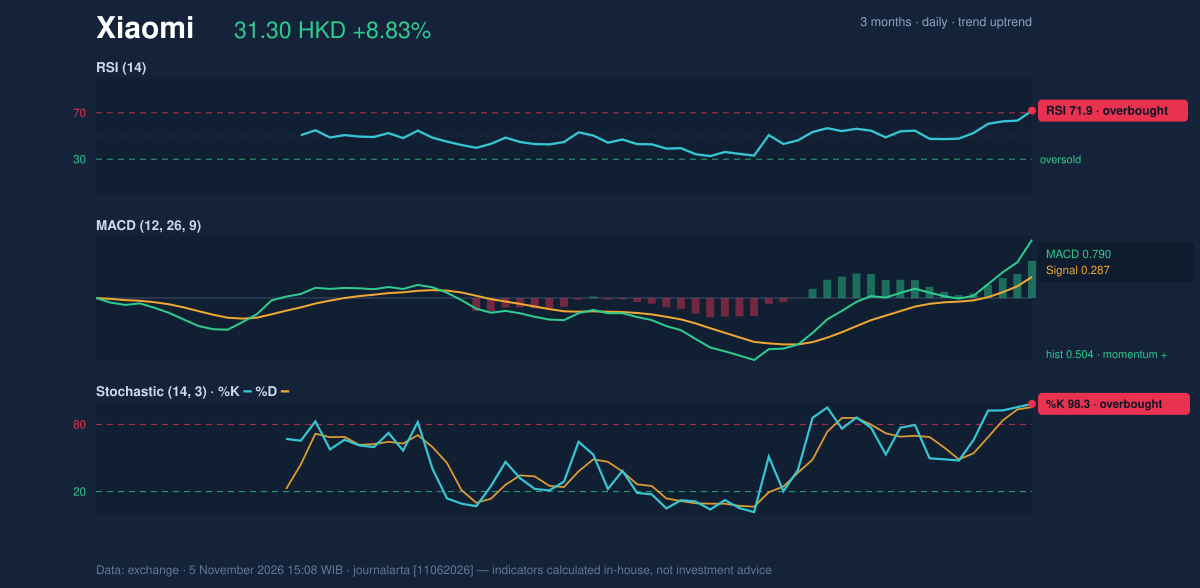
Volatility, Volume & Key Levels
The average true range (ATR), a measure of typical price movement, is HK$1.26, or 4.0% of the share price. The one-day gain was about 2.2 times that measure, underlining how forceful the session was—and how large ordinary price swings may feel at current volatility. Volume’s jump to 2.6 times its 20-day average and rising OBV provide useful confirmation that activity accompanied the advance. The immediate test is HK$31.30, the 20-day resistance and current price, followed by the three-month high at HK$31.40. A sustained move above the latter would put the shares beyond the supplied reference highs; the data do not provide a further resistance level. If the price fails to hold its breakout, HK$29.41—the price minus 1.5 times ATR—is a volatility-based reference. The broader 20-day support is HK$23.66, with the three-month low at HK$23.58.Technical Verdict: BUY
The data’s technical bias is bullish, supported by the latest-session golden cross, the close above the 20-day high on volume well above average, and rising OBV. The main counterweight is momentum: RSI and Stochastic are both overbought, while the price is above the upper Bollinger band. These conditions raise the risk of a pullback but do not overturn the confirming trend signals. - Ideal entry range: HK$29.89–HK$31.30, bounded by the upper Bollinger band and current resistance. - Exit target: HK$31.40, the three-month high and next supplied resistance. - Stop-loss protection: HK$29.41, the price minus 1.5 times ATR; the wider structural support is HK$23.66. - Invalidation: The bullish verdict is invalidated if the price falls below HK$23.66, the 20-day support. In plain English, the trend and trading activity point upward, but stretched momentum means the share may swing sharply along the way.Summary Data Xiaomi
| Last price | 31.30 HKD |
| Change 1 day / 5 days / 1 month | 8.83% / 21.88% / 30.74% |
| Trend / MA-cross | uptrend / golden |
| SMA20 / SMA50 | 26.64 / 26.55 |
| RSI (14) / Stochastic %K | 71.9 / 98.3 |
| Bollinger %B / ATR | 122% / 1.26 |
| Support / Resistance 20 days | 23.66 / 31.30 |
| Data as of | 5 November 2026 15:08 WIB |
Disclaimer: This technical analysis is generated automatically from exchange data and indicators calculated by JournalArta, for information and education only. The verdict and the entry, target and stop-loss levels are not investment advice or a solicitation to buy or sell any security. Investment decisions and their risks rest solely with the reader.
Track Xiaomi share price daily: live levels, support/resistance and our full Xiaomi analysis history.