RSI Overbought, DIS Stock Gains 4.18% on Wednesday
On November 4, 2026: price 118.95 USD, trend uptrend, RSI 74.8, support 107.02, resistance 118.95. technical analysis of dis stock. Peak — full details here.

Why DIS is in focus today
- One-day move of 4.18%, about 2.2× its average daily range (ATR)
- Volume at 1.6× the 20-day average
- Closed at a 20-day high (118.95)
- Trading near its 3-month high (119.96)
- RSI(14) at 74.8 — overbought zone
- Uptrend confirmed (5-day change 9.09%)
Selected automatically from 80 NYSE (US) stocks by a technical-signal score with daily weighted randomisation — not a recommendation.
Trend & Price Action
Disney is trading above its 20-day moving average of $110.94, which is itself rising 2.41% over five days, and above its 50-day average of $107.69. That structure supports the uptrend: buyers have pushed the price well beyond its short-term average, while the rising average suggests the advance is not confined to a single session. No new moving-average crossover has formed, so the trend case comes from price positioning and the averages’ direction rather than a fresh crossover signal. The close landed at the 20-day resistance level of $118.95, with the three-month high at $119.96 just above it. Price has reached 100% of its 20-day range, leaving little room before it tests the broader peak. That is a meaningful test: a move through the three-month high would extend the breakout, while failure to hold the recent advance could bring the moving averages and support into view.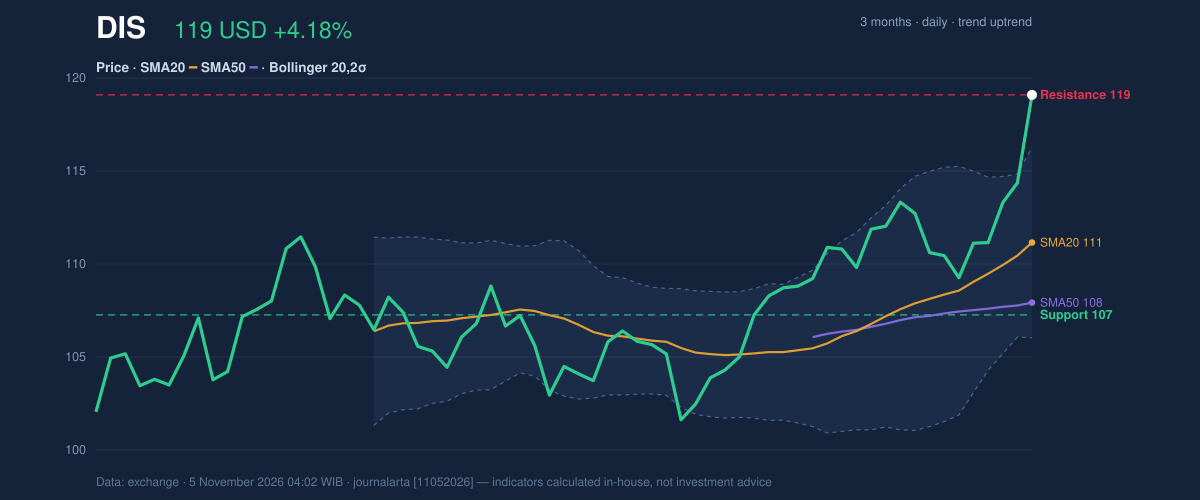
Oscillators & Momentum
Momentum indicators confirm the rally but warn that it may be stretched. The RSI is 74.8, in overbought territory, while the Stochastic readings of 91.0 and 91.7 are also overbought. These measures reflect how strongly price has advanced relative to its recent trading pattern; they do not, by themselves, establish that a reversal is underway. But they raise the risk that gains could pause or pull back as traders reassess the move. The MACD remains constructive: its value of 2.138 is above its 1.597 signal line, and the histogram is positive at 0.541. That suggests upward momentum is still gaining rather than fading. The technical-bias calculation also identifies the MACD histogram’s move into positive territory as a bullish signal.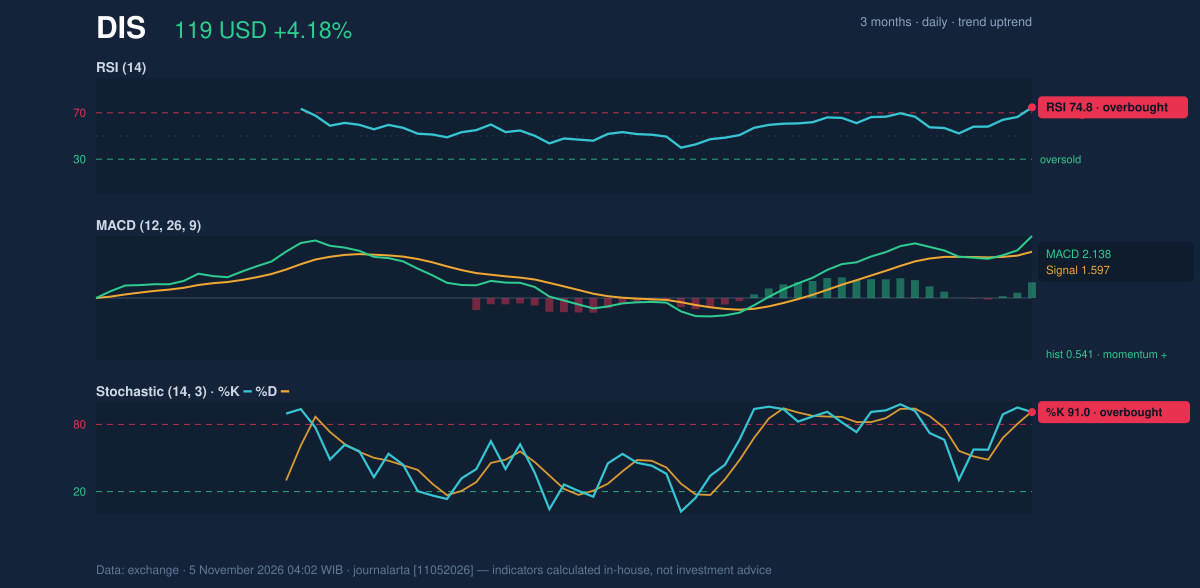
Volatility, Volume & Key Levels
Disney closed above the upper Bollinger Band at $116.11, with %B at 127%. Bollinger Bands track price relative to a moving average and its recent volatility; a reading above the upper band signals that price has pushed beyond its usual statistical envelope. The band width is 9.3%, described as normal, so the breakout is not occurring amid an unusually tight volatility squeeze. Volume reached 13,404,900 shares against a 20-day average of 8,277,835. Rising on above-average activity gives the rally stronger participation, and the rising On-Balance Volume (OBV)—a running measure that adds volume on up days and subtracts it on down days—supports that interpretation. Still, the overbought readings and close at resistance make follow-through important. The nearest reference is the three-month high at $119.96. If price moves above that level, the supplied volatility reference at $122.33—price plus 1.5 times ATR—marks a higher scenario level, not a forecast. On a retreat, $115.57, the price-minus-1.5-ATR reference, is a volatility-based marker; the 20-day support at $107.02 is the more substantial chart level. A break below that support would weaken the current technical case.Fundamental Context
According to its SEC filing, Disney reported quarterly revenue of $25.25 billion for the quarter ended June 27, 2026, up 6.8% from $23.65 billion a year earlier. Net income was $2.64 billion, compared with $5.26 billion a year earlier, and diluted earnings per share were $1.51. Revenue growth offers a constructive backdrop, while the lower net income is a reminder that stronger sales have not translated into higher reported profit for the quarter.Technical Verdict: BUY
The technical bias is bullish, with three of seven bullish signals and no bearish signals in the supplied assessment. The strongest support comes from the close at a 20-day high on volume at least 1.5 times average, a positive MACD histogram, and rising OBV confirming participation. The main counterweight is momentum stretched into overbought territory, particularly RSI at 74.8. - Ideal entry range: $115.57–$118.95, using the supplied ATR reference and 20-day resistance as the range boundaries. - Exit target: $119.96, the next resistance at the three-month high. - Stop-loss protection: Below $107.02, the 20-day support. - Invalidation: The verdict is invalidated if price falls below $107.02. For non-traders, the chart still favors the upward trend, but the stock’s overbought readings mean the advance could be tested before it continues.Summary Data DIS
| Last price | 118.95 USD |
| Change 1 day / 5 days / 1 month | 4.18% / 9.09% / 13.56% |
| Trend / MA-cross | uptrend / none |
| SMA20 / SMA50 | 110.94 / 107.69 |
| RSI (14) / Stochastic %K | 74.8 / 91.0 |
| Bollinger %B / ATR | 127% / 2.25 |
| Support / Resistance 20 days | 107.02 / 118.95 |
| Data as of | 5 November 2026 04:02 WIB |
Disclaimer: This technical analysis is generated automatically from exchange data and indicators calculated by JournalArta, for information and education only. The verdict and the entry, target and stop-loss levels are not investment advice or a solicitation to buy or sell any security. Investment decisions and their risks rest solely with the reader.
Track DIS stock price daily: live levels, support/resistance and our full DIS analysis history.