Golden Cross Formed, FANG Stock Drops 4.92% on Wednesday
On November 4, 2026: price 182.88 USD, trend sideways, RSI 36.4, support 182.88, resistance 212.08. technical analysis of fang stock. Golden Cross Formed —…
Why FANG is in focus today
- One-day move of -4.92%, about 1.3× its average daily range (ATR)
- Volume at 1.7× the 20-day average
- Closed at a 20-day low (182.88)
- Trading near its 3-month low (181.48)
- Fresh golden cross: SMA20 crossed above SMA50
- Not covered by JournalArta in the last 14 days
Selected automatically from 100 NASDAQ (US) stocks by a technical-signal score with daily weighted randomisation — not a recommendation.
Trend & Price Action
At $182.88, FANG traded below both its 20-day average of $199.74 and its 50-day average of $196.55. The averages remain close, with the 20-day line still above the 50-day line, but price action has broken down beneath both. The golden cross, formed three sessions before the latest session, signals that the shorter average had been improving relative to the longer one; it does not by itself confirm that buyers remain in control. The close was at the bottom of the 20-day range and near the three-month low of $181.48. It also finished below the lower Bollinger Band, at $186.29, with %B at -13%. Bollinger Bands compare price with a recent statistical range: a reading below the lower band marks an unusually weak close, but is not proof that a rebound is imminent. The band width of 13.5% is normal rather than compressed, so the setup does not show the kind of tight squeeze that can precede a sharp breakout.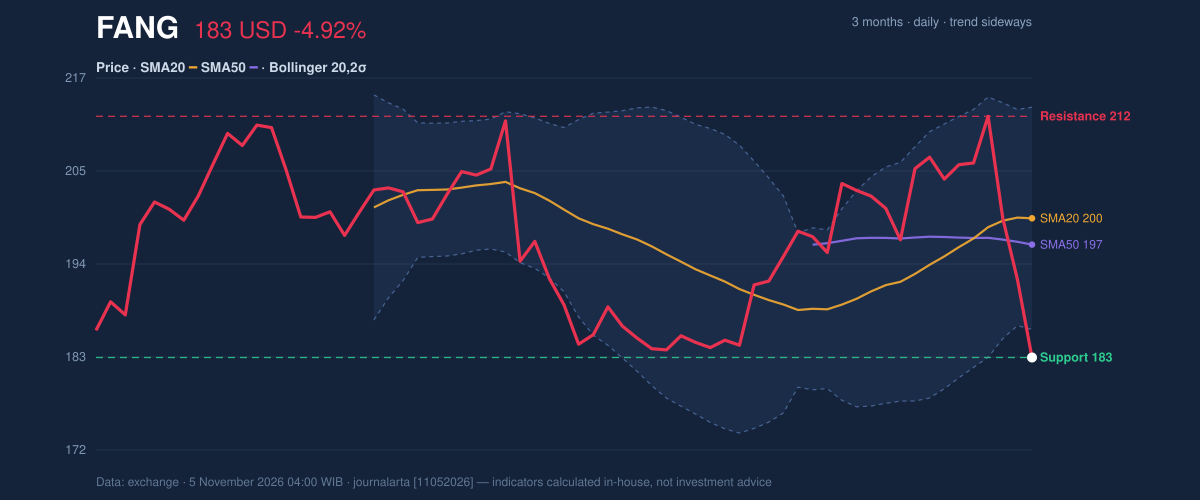
Oscillators & Momentum
Momentum indicators lean weaker than the golden cross suggests. RSI is 36.4, classified as neutral, but the technical screen flags it as rolling over from above 65. RSI measures the pace of recent gains and losses; this reading is not yet in oversold territory, while its recent turn down points to fading upside momentum. Stochastic is oversold, with %K at 4.5 and %D at 12.0. The indicator compares a close with its recent trading range, so such a low reading shows that price has been pressed toward the bottom of that range. It can precede a bounce, but needs confirmation from price or volume. Meanwhile, MACD momentum is negative: the MACD reading of 0.670 is below its 2.333 signal line, leaving the histogram at -1.663. The histogram turning negative indicates that near-term momentum has weakened, even though the MACD line itself remains above zero.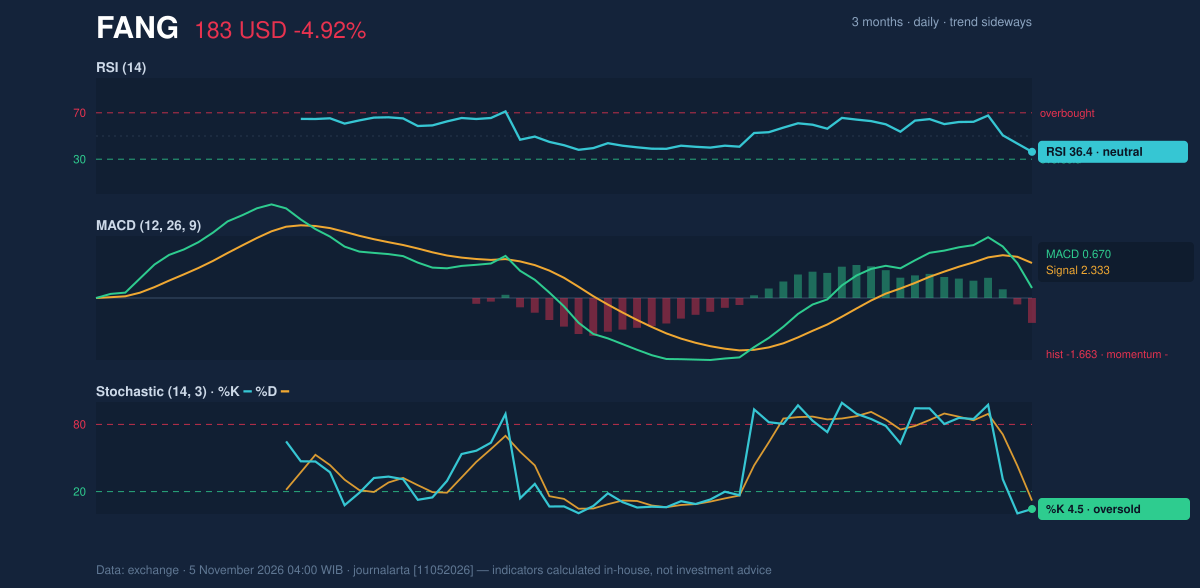
Volatility, Volume & Key Levels
Volume reached 3,452,500 shares, compared with a 20-day average of 2,074,615. That surge gives the decline more significance than a quiet pullback: more shares changed hands as the price fell, while OBV, a running measure of buying and selling volume, also declined. Together, they suggest selling pressure was not simply a low-participation move. ATR stands at $7.05, or 3.9% of the share price, indicating high day-to-day volatility and a wider margin for price swings. The immediate reference is support at $182.88, with the three-month low at $181.48. A sustained break below those levels would deepen the damage to the price structure; a hold could give oversold Stochastic room to turn, though the indicators offer no confirmation yet. On a recovery, $193.46—the price plus 1.5 times ATR—is a volatility-based reference, followed by the 50-day average at $196.55 and 20-day average at $199.74. The 20-day resistance is $212.08, below the three-month high of $216.90.Fundamental Context
The technical weakness contrasts with Diamondback’s latest reported quarterly results. According to its SEC filing, revenue for the quarter ended September 30, 2026, was $5.43 billion, up 38.4% from $3.92 billion a year earlier. Net income was $1.60 billion versus $1.02 billion, and diluted earnings per share were $5.69. Those results provide a stronger operating backdrop, but do not negate the market’s near-term selling signal.Technical Verdict: SELL
The technical bias is bearish: price closed below both moving averages at its 20-day low; MACD’s histogram has turned negative at -1.663; and the decline came with volume at 1.7 times its 20-day average. The golden cross formed three sessions earlier is a counter-signal, while oversold Stochastic leaves room for a short-term bounce. This verdict is invalidated if price breaks above the $212.08 20-day resistance.- Entry range: $182.88–$193.46, spanning the 20-day support and the price-plus-1.5-ATR reference.
- Exit target: $182.88, the 20-day support; the three-month low at $181.48 is the next reference if support breaks.
- Stop-loss protection: $212.08, the 20-day resistance.
Summary Data FANG
| Last price | 182.88 USD |
| Change 1 day / 5 days / 1 month | -4.92% / -11.32% / -0.81% |
| Trend / MA-cross | sideways / golden |
| SMA20 / SMA50 | 199.74 / 196.55 |
| RSI (14) / Stochastic %K | 36.4 / 4.5 |
| Bollinger %B / ATR | -13% / 7.05 |
| Support / Resistance 20 days | 182.88 / 212.08 |
| Data as of | 5 November 2026 04:00 WIB |
Disclaimer: This technical analysis is generated automatically from exchange data and indicators calculated by JournalArta, for information and education only. The verdict and the entry, target and stop-loss levels are not investment advice or a solicitation to buy or sell any security. Investment decisions and their risks rest solely with the reader.
Track FANG stock price daily: live levels, support/resistance and our full FANG analysis history.