Rio Tinto Stock Technicals: Gains 2.02% on Wednesday, Momentum Weakens
On November 4, 2026: price 6,201.00 GBp, trend downtrend, RSI 34.4, support 6,078.00, resistance 7,144.00. technical analysis of rio tinto stock.
Why Rio Tinto is in focus today
- Volume at 3.1× the 20-day average
- Downtrend extending (5-day change -3.00%)
Selected automatically from 98 LSE (UK) stocks by a technical-signal score with daily weighted randomisation — not a recommendation.
Trend & Price Action
At 6,201.00 GBp, the shares sit below the 20-day average of 6,542.40 and the 50-day average of 7,011.78. The 20-day average is also below the 50-day average, and there has been no new moving-average crossover. In plain terms, neither the short-term price trend nor the longer reference average is signalling a confirmed recovery. The price is near the bottom of its recent range: the 20-day support is 6,078.00, while resistance is 7,144.00, leaving the latest price in the lower portion of that band. The three-month low of 6,064.00 is close to support, making the area around those levels an important test. A sustained hold could help stabilize the chart; a break below would put the recent low back in focus. The 2.02% session rise is a bounce, not yet evidence that the downtrend has turned.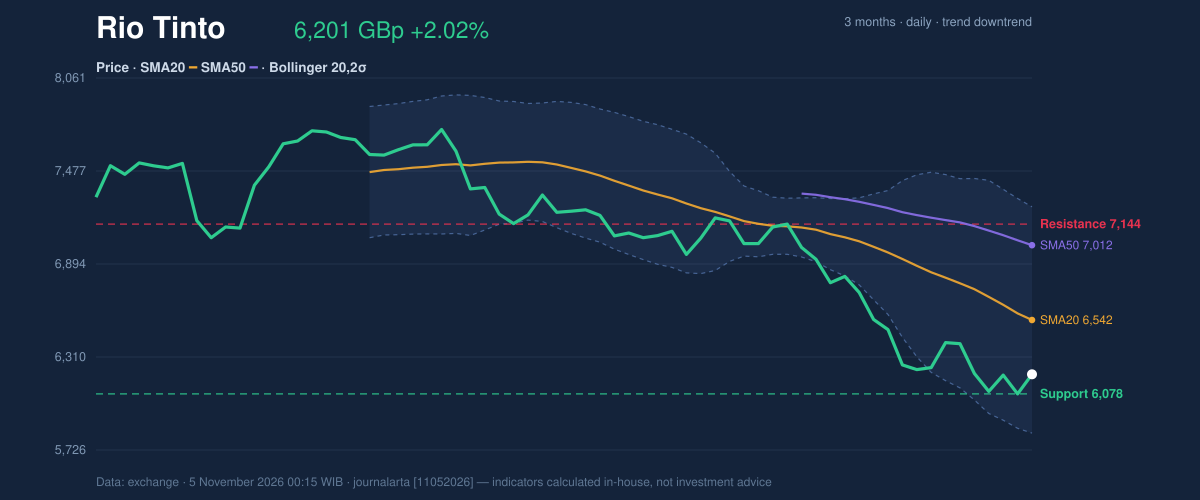
Oscillators & Momentum
Momentum indicators offer mixed signals. The RSI is 34.4, classified as neutral, and remains below the midpoint typically associated with stronger positive momentum. The Stochastic oscillator is more stretched: %K is 17.5 and %D is 8.4, both in oversold territory. Oversold readings can accompany a short-term rebound, but they do not by themselves confirm one; in a falling market, weak conditions can persist. The MACD remains negative at -257.903, below its signal line of -240.012, with a histogram of -17.891. That negative MACD configuration indicates downside momentum is still in place. Together, the indicators suggest that selling pressure may be stretched in the short term, but has not yet been displaced by a clear momentum reversal.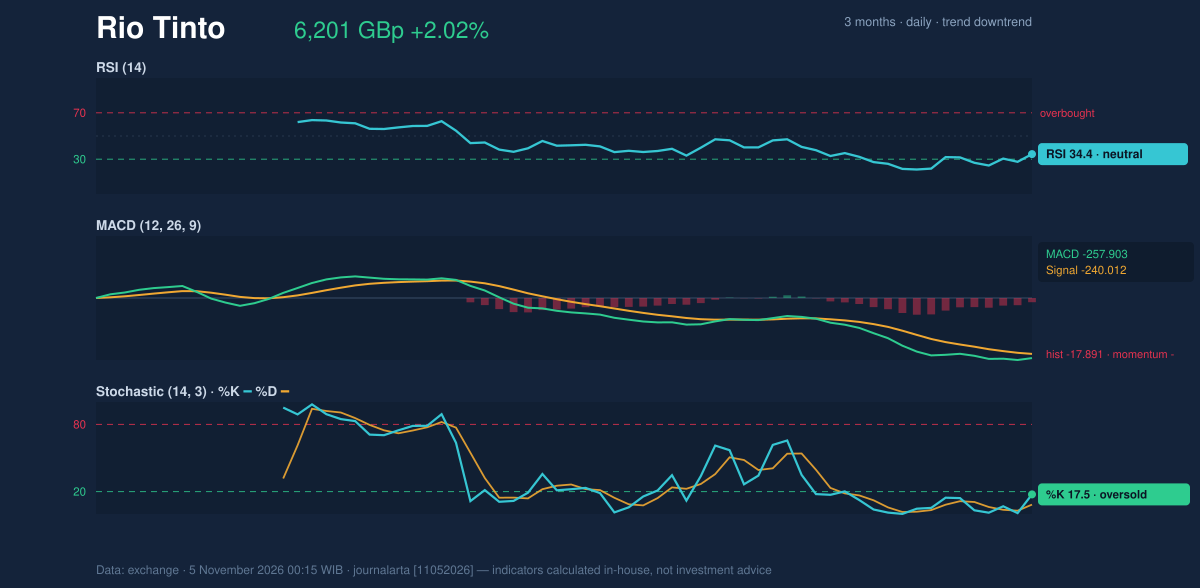
Volatility, Volume & Key Levels
The share price is at 26% of the way through its Bollinger Band range, nearer the lower band at 5,832.14 than the upper band at 7,252.66. The bands are widening, with a width of 21.7%, signalling elevated and expanding volatility rather than a quiet consolidation. The 14-day average true range, a measure of typical price movement, is 159.36 GBp, or 2.6% of the share price—consistent with meaningful day-to-day swings. Volume of 8,272,077 was 3.1 times the 20-day average of 2,670,631. That is a notable surge, but the falling on-balance volume (OBV)—a running measure of whether volume generally accompanies rising or falling prices—means participation has not yet confirmed accumulation. The combination matters: a busy session can mark a change in mood, but falling OBV cautions that demand has not clearly taken control. Support sits at 6,078.00 GBp, with resistance at 7,144.00 GBp. The proximity of support to the three-month low of 6,064.00 makes a downside break consequential. On the upside, the shares would need to regain the 20-day average at 6,542.40 before a stronger challenge to resistance looked more credible. The chart shows these reference points alongside the moving averages and bands.Technical Verdict: HOLD (wait & see)
The technical bias is neutral: price remains in a downtrend, while oversold Stochastic readings and a high-volume rebound argue against treating weakness as one-way. The strongest cautions are the falling 20-day average and negative MACD; the strongest counterpoint is the oversold Stochastic, which leaves room for a bounce without proving a reversal. Falling OBV also confirms the downtrend in the supplied signal assessment. - Indicative entry range: 6,078.00–6,542.40 GBp, spanning 20-day support to the 20-day average. - Reference exit target: 7,144.00 GBp, the 20-day resistance. - Stop-loss reference: 5,961.96 GBp, the price-minus-1.5×ATR level. - Invalidation: the neutral assessment would be invalidated on the downside if price breaks below 6,078.00 GBp support. These levels describe the chart’s technical setup, not an investment recommendation. For non-traders, the shares are caught between nearby support and an unconfirmed rebound, so the next move needs confirmation.| Indicator | Reading |
|---|---|
| Last price | 6,201.00 GBp |
| Change | 1 day: 2.02% | 5 days: -3.00% | 1 month: -11.69% |
| SMA20 / SMA50 | 6,542.40 / 7,011.78 |
| RSI / Stochastic | 34.4 / %K 17.5, %D 8.4 |
| MACD / signal / histogram | -257.903 / -240.012 / -17.891 |
| Bollinger Bands | 5,832.14 / 6,542.40 / 7,252.66 |
| Volume / 20-day average | 8,272,077 / 2,670,631 |
| Support / resistance | 6,078.00 / 7,144.00 GBp |
| ATR(14) | 159.36 GBp |
Summary Data Rio Tinto
| Last price | 6,201.00 GBp |
| Change 1 day / 5 days / 1 month | 2.02% / -3.00% / -11.69% |
| Trend / MA-cross | downtrend / none |
| SMA20 / SMA50 | 6,542.40 / 7,011.78 |
| RSI (14) / Stochastic %K | 34.4 / 17.5 |
| Bollinger %B / ATR | 26% / 159.36 |
| Support / Resistance 20 days | 6,078.00 / 7,144.00 |
| Data as of | 5 November 2026 00:15 WIB |
Disclaimer: This technical analysis is generated automatically from exchange data and indicators calculated by JournalArta, for information and education only. The verdict and the entry, target and stop-loss levels are not investment advice or a solicitation to buy or sell any security. Investment decisions and their risks rest solely with the reader.
Track Rio Tinto share price daily: live levels, support/resistance and our full Rio Tinto analysis history.