ICBC Golden Cross Formed: Stock Gains 1.03% (November 4, 2026)
On November 4, 2026: price 7.82 HKD, trend uptrend, RSI 58.9, support 7.24, resistance 7.89. technical analysis of icbc stock. ICBC Golden Cross Formed — full…
ICBC shares rose 1.03% to HK$7.82 on Wednesday, November 4, according to the supplied Hong Kong market data, as a recently formed golden cross and gains over the past five sessions put the lender’s upward trend in focus. The signal is constructive, but the price is already close to a key resistance level, while trading volume was below its 20-session average.
Why ICBC is in focus today
- Fresh golden cross: SMA20 crossed above SMA50
- Uptrend confirmed (5-day change 2.83%)
Selected automatically from 72 HKEX (Hong Kong) stocks by a technical-signal score with daily weighted randomisation — not a recommendation.
Trend & Price Action
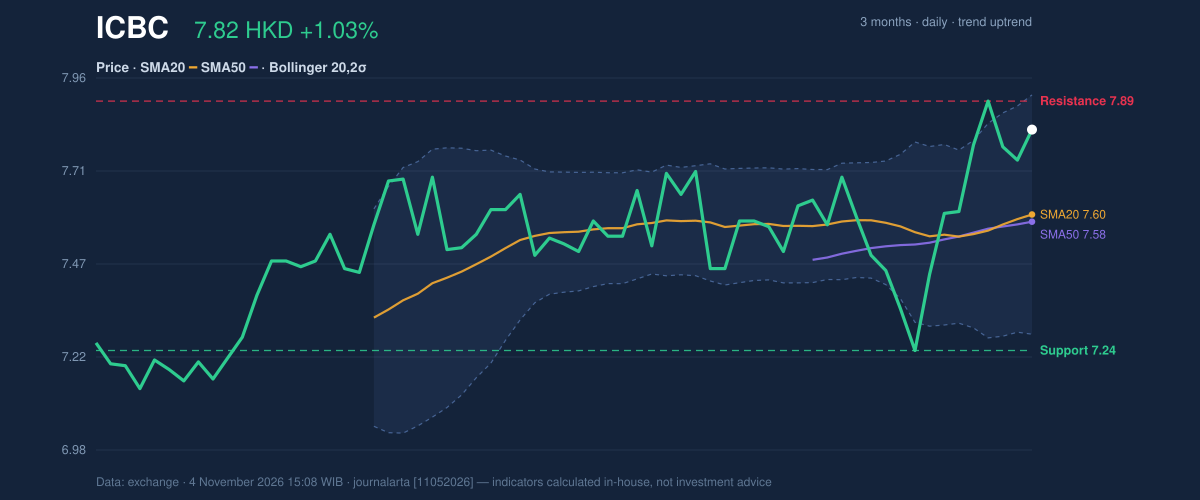
The stock gained 2.83% over five sessions and 3.17% over one month. Its price remains above the 20-day moving average of HK$7.60 and the 50-day average of HK$7.58. The 20-day average itself rose 0.77% over five days, indicating that the short-term trend is improving rather than simply reflecting a one-day jump.
A golden cross formed two sessions before the latest session, when the 20-day average moved above the 50-day average. This is a commonly watched trend signal: it suggests recent price action has strengthened relative to the longer average, though it does not guarantee that gains will continue. The stock is also above its 20-day average, consistent with the reported uptrend.
As shown in the chart, ICBC is near the upper end of its recent trading range: it stands at 89% of the range between 20-session support at HK$7.24 and resistance at HK$7.89. The three-month high of HK$8.18 is a further reference if the nearer resistance is cleared.
Oscillators & Momentum
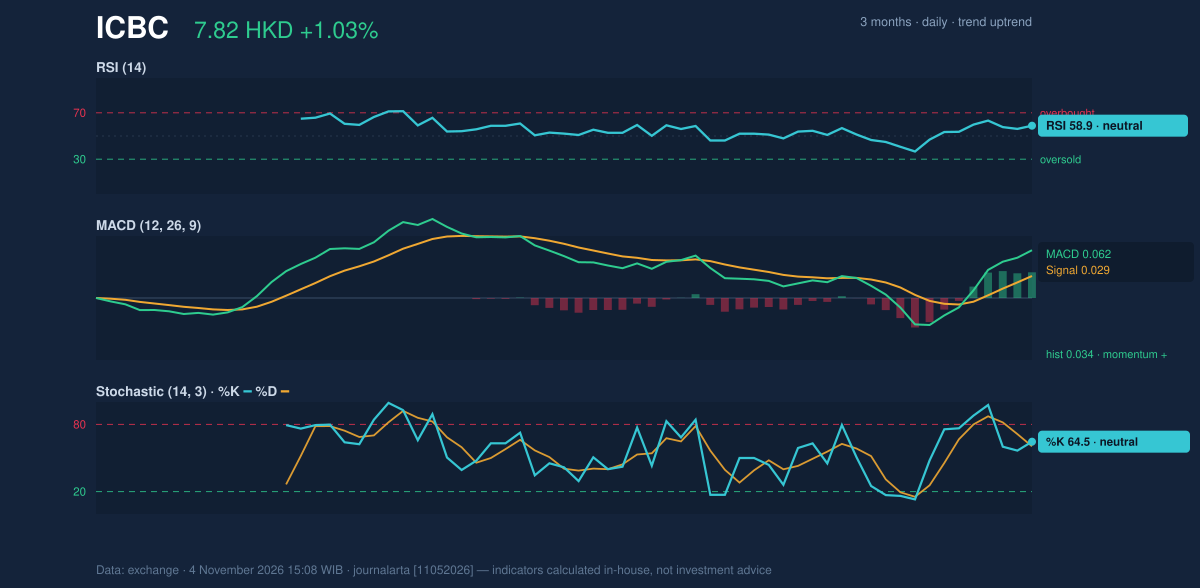
Momentum indicators support the upward bias without showing an extreme reading. The RSI is 58.9, in neutral territory, while the Stochastic readings are also neutral, with %K at 64.5 and %D at 60.4. These levels point to positive but not unusually stretched momentum, leaving less evidence of an immediate overbought condition.
The MACD is positive at 0.062, above its 0.029 signal line, and its histogram is 0.034. That configuration indicates improving momentum: the faster measure of price trend is ahead of its signal line. As shown in the chart, the momentum picture is broadly consistent with the moving-average crossover rather than diverging from it.
Volatility, Volume & Levels
The Bollinger Bands are at normal width, not compressed into a squeeze or sharply expanding. The %B reading of 85% places the price toward the upper band, at HK$7.91, which is consistent with strength but also means the stock is approaching a zone where resistance may matter. The middle band is HK$7.60 and the lower band HK$7.28.
Average true range, a measure of typical price movement, is HK$0.24, or 3.0% of the share price, indicating moderate volatility. Volume was 185.2 million shares, about 0.9 times the 20-session average of 207.3 million. That is a modest caveat: the rise did not come with above-average participation. However, OBV—the running balance of volume associated with rising and falling sessions—is increasing, offering a sign that underlying accumulation remains supportive.
A sustained move above HK$7.89 would bring the three-month high at HK$8.18 into focus. Failure to hold the rising trend would make the HK$7.60 20-day average an early reference, with 20-session support at HK$7.24 providing a deeper test.
Technical Verdict: BUY
The data’s technical bias is bullish, with no reported bearish signals. The main supports are the golden cross formed two sessions ago, a positive MACD with the line above its signal, and rising OBV. The near-term constraint is price proximity to resistance, alongside below-average volume; these temper the strength of the setup but do not, on the supplied indicators, overturn the bullish bias. The verdict is invalidated if the price falls below HK$7.24, the 20-session support.
- Ideal entry range: HK$7.60–HK$7.82, using the 20-day average and latest price as reference levels.
- Exit target: HK$7.89, the next 20-session resistance; above that level, the three-month high at HK$8.18 is the next reference.
- Stop-loss protection: Below HK$7.24, the 20-session support.
In plain English, the indicators favor the upward trend, but the share is nearing resistance and the signal would weaken materially below support.
Summary Data ICBC
| Last price | 7.82 HKD |
| Change 1 day / 5 days / 1 month | 1.03% / 2.83% / 3.17% |
| Trend / MA-cross | uptrend / golden |
| SMA20 / SMA50 | 7.60 / 7.58 |
| RSI (14) / Stochastic %K | 58.9 / 64.5 |
| Bollinger %B / ATR | 85% / 0.24 |
| Support / Resistance 20 days | 7.24 / 7.89 |
| Data as of | 4 November 2026 15:08 WIB |
Disclaimer: This technical analysis is generated automatically from exchange data and indicators calculated by JournalArta, for information and education only. The verdict and the entry, target and stop-loss levels are not investment advice or a solicitation to buy or sell any security. Investment decisions and their risks rest solely with the reader.
Track ICBC share price daily: live levels, support/resistance and our full ICBC analysis history.