HKEX Stock Gains 1.75%, Testing Key Resistance In Focus
On November 4, 2026: price 384.00 HKD, trend sideways, RSI 57.0, support 363.80, resistance 384.00. technical analysis of hkex stock. HKEX Stock Gains — full…
Hong Kong Exchanges and Clearing closed at HK$384.00 on Wednesday, November 4, 2026, breaking above its 20-day Bollinger Band and ending at the top of its recent trading range as volume climbed to 1.7 times its 20-day average. The breakout has participation behind it. But with the price also at 20-day resistance and Stochastic in overbought territory, the advance faces a test of whether buyers can sustain the move.
Why HKEX is in focus today
- Volume at 1.7× the 20-day average
- Closed at a 20-day high (384.00)
- Breaking out of a Bollinger squeeze (band width 5.4%)
Selected automatically from 72 HKEX (Hong Kong) stocks by a technical-signal score with daily weighted randomisation — not a recommendation.
Trend & Price Action
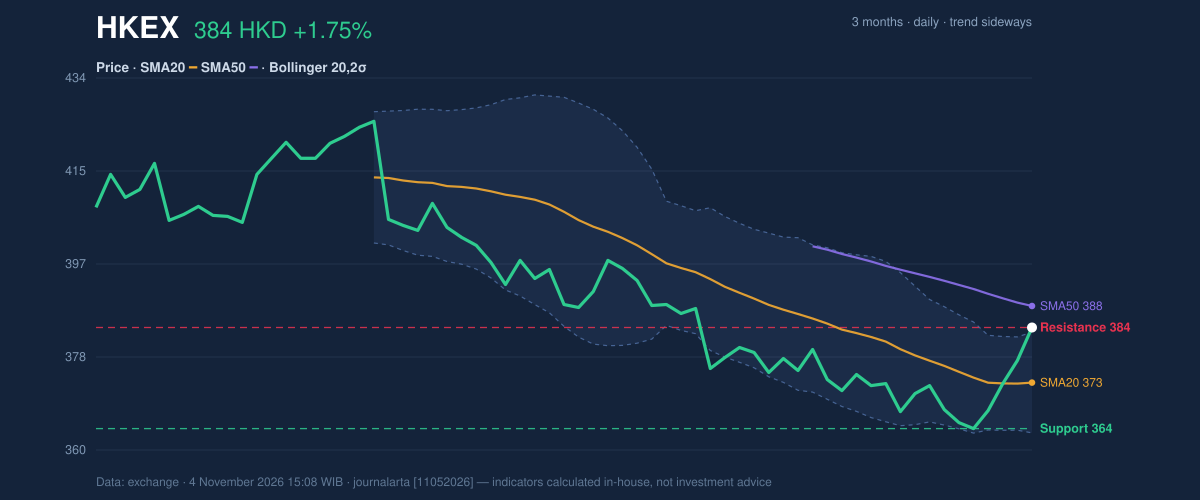
HKEX gained 1.75% in one day and 5.21% over five days, while its one-month change was 1.05%. The close stands above the 20-day moving average at HK$373.00, but below the 50-day average at HK$388.30. That combination points to improving short-term momentum within a still-mixed broader trend, rather than a confirmed longer-term uptrend. The 20-day average’s slope is negative: it fell 0.57% over five days, so the underlying short-term trend has not yet turned decisively upward.
Price finished above the upper Bollinger Band at HK$383.07, with the band width having narrowed to 5.4% before the squeeze resolved. A squeeze is a period of unusually compressed price bands; a break above the upper band can signal an increase in momentum, though it does not guarantee the move will continue. No new moving-average crossover has formed. HK$384.00 is both the close and the 20-day resistance, putting the stock at the upper edge of its recent range; the three-month high is HK$426.00.
As shown in the price chart, the band breakout has put the close above the recent ceiling, while the moving averages show why confirmation matters: price is above the 20-day average but still below the 50-day average.
Oscillators & Momentum
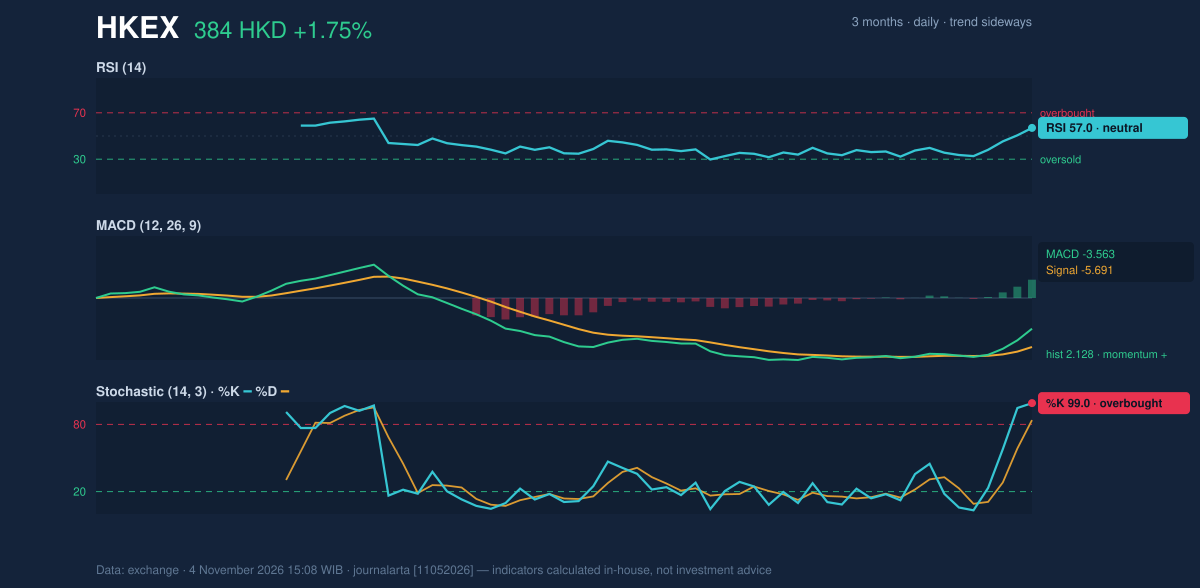
The momentum indicators are positive, but not uniformly so. RSI is 57.0, a neutral reading, leaving room between the current level and the conventional overbought zone. The supplied technical signals also describe RSI as rebounding from below 35, a recovery that suggests selling pressure has eased. Meanwhile, Stochastic %K at 99.0 and %D at 83.8 is overbought; this measures where the close sits within a recent price range and warns that the advance may be stretched in the short term.
MACD is above its signal line: the MACD reading is -3.563, the signal is -5.691 and the histogram is positive at 2.128. Although both MACD lines remain below zero, the positive histogram indicates improving momentum relative to the signal line. That is supportive of the breakout, but it does not erase the risk of a pause signalled by the Stochastic reading.
The momentum chart helps show this tension: MACD is improving, while Stochastic’s overbought reading suggests the move could meet near-term resistance.
Volatility, Volume & Key Levels
Trading volume reached 4,822,202 shares, against a 20-day average of 2,910,156, while OBV rose. Higher volume and rising OBV indicate that the breakout drew broader participation rather than occurring on thinning turnover. ATR was HK$5.71, or 1.5% of the price, indicating relatively low recent volatility. That can make a breakout easier to track, but the narrow bands also mean a move away from the compressed range may bring a change in volatility.
Resistance is HK$384.00, the 20-day ceiling now being tested; the next stated reference above it is the three-month high at HK$426.00. A sustained move beyond resistance would leave that high as the next major reference. Support is HK$363.80, with the three-month low at HK$363.20. The HK$373.00 20-day average and HK$375.43 level—price minus 1.5 times ATR—are nearer references if the stock pulls back. Failure to hold the support area would weaken the breakout case.
Technical Verdict: BUY
The technical bias is bullish, supported by a close above the 20-day high on volume at least 1.5 times average, the Bollinger squeeze resolving with a close above the upper band, and improving MACD momentum. This is tempered by overbought Stochastic and the price remaining below the 50-day average. The verdict is invalidated if the price falls below HK$363.80, the stated 20-day support.
- Ideal Entry Range: HK$373.00–HK$384.00, using the 20-day average and 20-day resistance as reference levels.
- Exit Target: HK$426.00, the three-month high and next stated resistance above HK$384.00.
- Stop Loss: Below HK$363.80, the 20-day support.
In plain English, the chart favours further strength, but the breakout needs to hold above support to remain intact.
Summary Data HKEX
| Last price | 384.00 HKD |
| Change 1 day / 5 days / 1 month | 1.75% / 5.21% / 1.05% |
| Trend / MA-cross | sideways / none |
| SMA20 / SMA50 | 373.00 / 388.30 |
| RSI (14) / Stochastic %K | 57.0 / 99.0 |
| Bollinger %B / ATR | 105% / 5.71 |
| Support / Resistance 20 days | 363.80 / 384.00 |
| Data as of | 4 November 2026 15:08 WIB |
Disclaimer: This technical analysis is generated automatically from exchange data and indicators calculated by JournalArta, for information and education only. The verdict and the entry, target and stop-loss levels are not investment advice or a solicitation to buy or sell any security. Investment decisions and their risks rest solely with the reader.
Track HKEX share price daily: live levels, support/resistance and our full HKEX analysis history.