CICT Testing Key Resistance: Stock Gains 1.30% (November 4, 2026)
On November 4, 2026: price 2.33 SGD, trend sideways, RSI 64.1, support 2.20, resistance 2.33. technical analysis of cict stock. CICT Testing Key Resistance —…

Why CICT is in focus today
- Volume at 2.0× the 20-day average
- Closed at a 20-day high (2.33)
- Breaking out of a Bollinger squeeze (band width 6.2%)
Selected automatically from 32 SGX (Singapore) stocks by a technical-signal score with daily weighted randomisation — not a recommendation.
Trend & Price Action
CICT rose 3.10% over five days and 2.64% over one month. The price is above its 20-day moving average of S$2.25, which has risen 0.51% over five days, but the 20-day average remains below the 50-day average of S$2.27. There is no new moving-average crossover. Together, those readings point to a sideways trend with a modest positive tilt, rather than a confirmed longer-term reversal. The unit closed at S$2.33, exactly at the 20-day resistance and the top of its recent range. It is also above the Bollinger upper band of S$2.32. A close above that band after a squeeze—when the bands narrow as price volatility eases—can signal a breakout attempt. But the close is only one step beyond the band, and the resistance level remains a test rather than cleared ground. The three-month high of S$2.53 is the next reference point if the advance extends.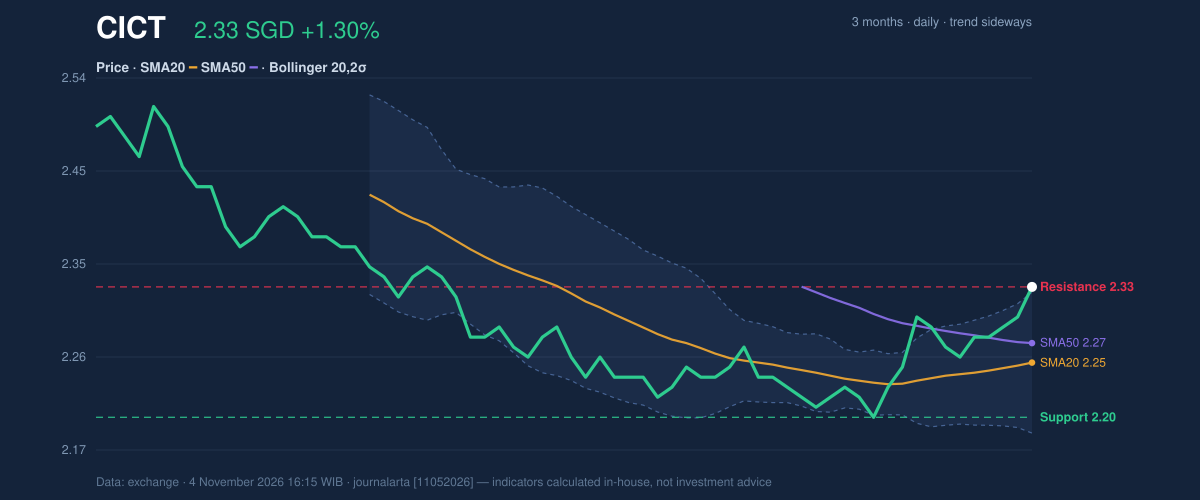
Oscillators & Momentum
Momentum confirms some buying pressure, though not without caution. The RSI is 64.1, in neutral territory: it indicates strengthening momentum but is not, by itself, an overbought reading. The Stochastic is overbought, with %K at 81.2 and %D at 79.9. That can occur during a strong advance, but it also means the price may be vulnerable to a pause or pullback. The MACD is positive at 0.009, above its signal line at -0.002, with a positive histogram of 0.011. This supports the case that short-term momentum is improving. The signals are therefore mixed in an important way: MACD and the price breakout lean positive, while the Stochastic warns that the move may be stretched.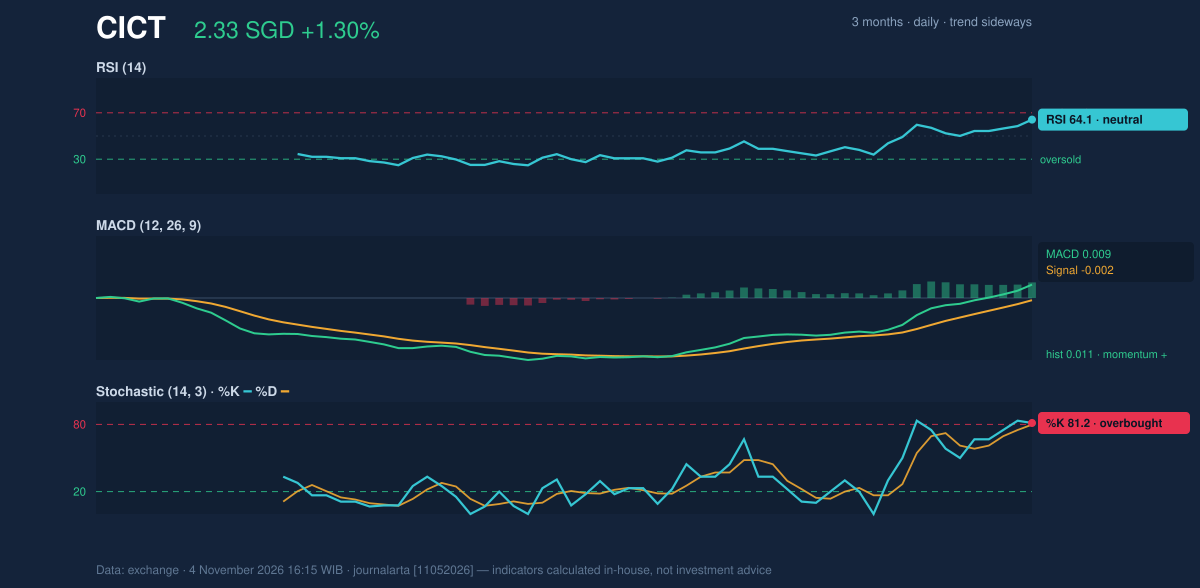
Volatility, Volume & Key Levels
The Bollinger band width narrowed to 6.2% before the close above the upper band, a squeeze followed by a potential breakout. The %B reading of 104% places the price above the band’s upper edge; it shows strength, but also puts the unit beyond its recent volatility envelope. The 14-day ATR is S$0.05, or 2.0% of the price, indicating moderate day-to-day movement—not a guarantee that the price will stay within that range. Participation strengthens the breakout signal. Volume reached 73,513,800 units, 2.0 times the 20-day average, and OBV rose. OBV, or on-balance volume, tracks whether trading volume is flowing more on rising or falling sessions; its increase supports the view that buyers participated in the advance. Still, the price closed at the S$2.33 20-day resistance, so follow-through matters. Holding above that level would strengthen the breakout case; a retreat toward the S$2.20 support would put the squeeze resolution in doubt.Technical Verdict: HOLD
The neutral verdict reflects a balance of signals, not an absence of movement. The close above the upper Bollinger band on volume twice the 20-day average, rising OBV and positive MACD are supportive. Against that, Stochastic is overbought and the close sits at resistance, while price remains below the 50-day average. The verdict is invalidated if price falls below S$2.20, the 20-day support. - Indicative entry range: S$2.20–S$2.33, bounded by 20-day support and resistance. - Exit target: S$2.53, the three-month high, if price moves above the S$2.33 resistance. - Stop-loss protection level: S$2.20, at 20-day support. In plain English, the breakout has encouraging volume behind it, but the price is testing resistance while short-term momentum looks stretched.Data
CICT (SGX: C38U.SI); exchange session: Wednesday, November 4, 2026. Last price: S$2.33; previous close: S$2.30. Change: 1 day +1.30%, 5 days +3.10%, 1 month +2.64%. SMA20: S$2.25; SMA50: S$2.27; no new MA crossover. Bollinger (20, 2σ): upper S$2.32, middle S$2.25, lower S$2.18; %B 104%; width 6.2%. RSI(14): 64.1; Stochastic %K 81.2, %D 79.9; MACD 0.009, signal -0.002, histogram 0.011. ATR(14): S$0.05. Volume: 73,513,800; 20-day average: 35,960,299; OBV rising. 20-day support: S$2.20; 20-day resistance: S$2.33. Three-month high/low: S$2.53/S$2.20. Technical bias: neutral (2 of 7 bullish signals; 0 of 7 bearish signals). Technical analysis is educational and is not an investment recommendation.Summary Data CICT
| Last price | 2.33 SGD |
| Change 1 day / 5 days / 1 month | 1.30% / 3.10% / 2.64% |
| Trend / MA-cross | sideways / none |
| SMA20 / SMA50 | 2.25 / 2.27 |
| RSI (14) / Stochastic %K | 64.1 / 81.2 |
| Bollinger %B / ATR | 104% / 0.05 |
| Support / Resistance 20 days | 2.20 / 2.33 |
| Data as of | 4 November 2026 16:15 WIB |
Disclaimer: This technical analysis is generated automatically from exchange data and indicators calculated by JournalArta, for information and education only. The verdict and the entry, target and stop-loss levels are not investment advice or a solicitation to buy or sell any security. Investment decisions and their risks rest solely with the reader.
Track CICT share price daily: live levels, support/resistance and our full CICT analysis history.