Visa Stock Drops 1.20%, Testing Key Resistance In Focus
On November 3, 2026: price 420.42 USD, trend uptrend, RSI 69.1, support 372.10, resistance 425.51. technical analysis of visa stock. Peak — full details here.
Why Visa is in focus today
- Trading near its 3-month high (426.78)
- Uptrend confirmed (5-day change 4.62%)
Selected automatically from 80 NYSE (US) stocks by a technical-signal score with daily weighted randomisation — not a recommendation.
Trend & Price Action
Visa’s share price sits above both its 20-day moving average of $401.40 and its 50-day average of $383.16, a structure consistent with an established uptrend. The 20-day average rose 3.22% over five days, reinforcing the upward direction rather than merely reflecting a one-session bounce. No new moving-average crossover has formed. The stock is trading near the top of its recent range: the three-month high is $426.78, while the 20-day resistance is $425.51. The latest price is at 90% of its 20-day range, leaving limited room before those ceilings come into play. The uptrend is intact, but Visa is testing resistance rather than breaking clear of it.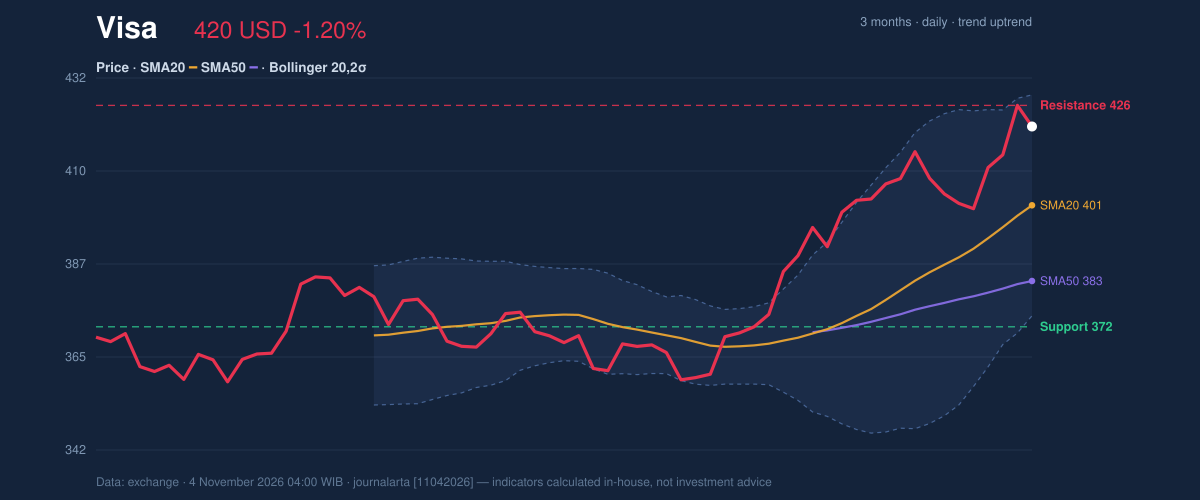
Oscillators & Momentum
Momentum indicators offer a mixed reading. The Relative Strength Index, or RSI, is 69.1 and classified as neutral in the data; it is elevated, but does not by itself establish an overbought condition. By contrast, the Stochastic oscillator has %K at 80.6 and %D at 88.3, both reflecting an overbought reading. That can occur when prices have advanced quickly, and it raises the risk of a pause even while the wider trend remains positive. Stochastic is overbought, while MACD remains positive at 10.900 against a 9.601 signal line, with a positive 1.299 histogram. MACD compares shorter- and longer-term price momentum; its positive configuration says upward pressure has not yet vanished. The indicators therefore point to a strong recent advance that may be losing some short-term balance, rather than a confirmed reversal.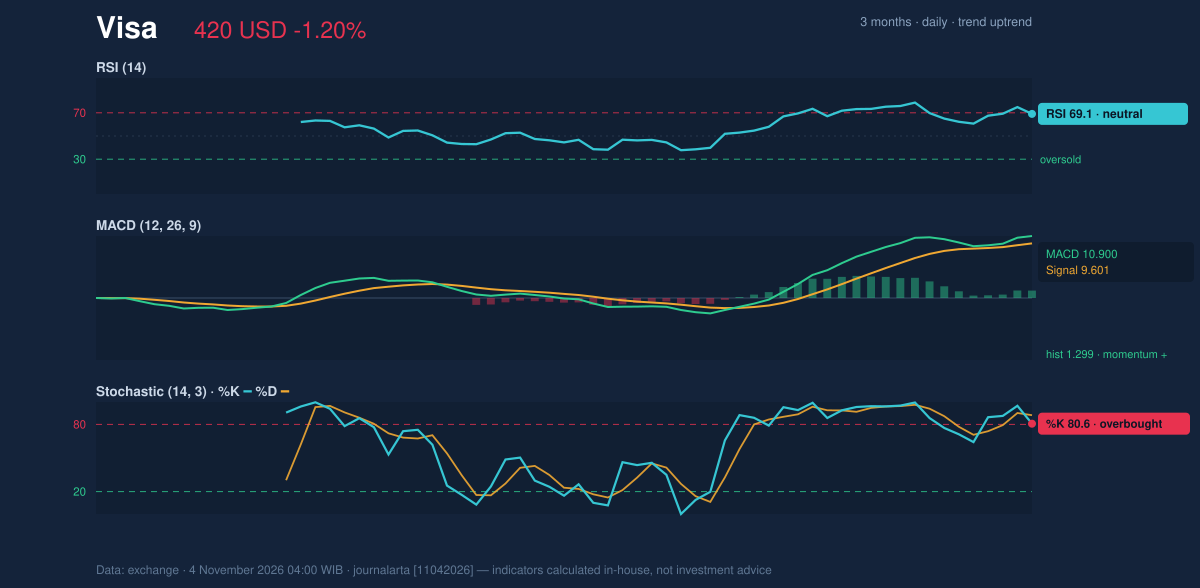
Volatility & Participation
Average True Range, a measure of typical daily movement, stands at $7.84, or 1.9% of the share price, indicating moderate volatility. That makes a pullback within the current range plausible without necessarily breaking the larger uptrend. Trading volume was 5,521,500 shares, about 0.8 times the 20-day average of 6,535,325. The session’s decline therefore came on below-average participation, while On-Balance Volume (OBV), which tracks whether volume tends to accompany rising or falling prices, is rising. Rising OBV supports the uptrend, but lighter-than-normal volume gives the latest move less confirmation.Key Levels & Scenarios
Resistance stands at $425.51, with the three-month high at $426.78. A move above that zone would place the stock beyond the cited recent ceiling; failure to clear it could leave the price consolidating after its advance. On the downside, the 20-day average at $401.40 is a nearer reference for the trend, while the 20-day support at $372.10 marks a deeper boundary.Fundamental Context
Visa filed a Form 8-K with the U.S. Securities and Exchange Commission on October 27, 2026, reporting results of operations and financial condition and other material events, according to its SEC filing. The filing provides the relevant disclosure context, but the technical verdict below is based on the price and indicator data for the session.Technical Verdict: HOLD (wait & see)
The technical bias is neutral, with one of seven bullish signals and no bearish signals. The uptrend and rising OBV are constructive, but the proximity to resistance, overbought Stochastic reading and below-average volume leave insufficient confirmation for a directional verdict. - Ideal entry range: $401.40–$408.66, using the 20-day average and the price-minus-1.5-ATR reference. - Exit target: $425.51–$426.78, the 20-day resistance and three-month high. - Stop-loss protection: Below $372.10, the 20-day support. - Invalidation: The neutral verdict is invalidated if price falls below $372.10. For non-traders, HOLD means the signals do not yet show a clear direction, so the resistance test and the stock’s ability to retain support matter most.Summary Data Visa
| Last price | 420.42 USD |
| Change 1 day / 5 days / 1 month | -1.20% / 4.62% / 13.43% |
| Trend / MA-cross | uptrend / none |
| SMA20 / SMA50 | 401.40 / 383.16 |
| RSI (14) / Stochastic %K | 69.1 / 80.6 |
| Bollinger %B / ATR | 86% / 7.84 |
| Support / Resistance 20 days | 372.10 / 425.51 |
| Data as of | 4 November 2026 04:00 WIB |
Disclaimer: This technical analysis is generated automatically from exchange data and indicators calculated by JournalArta, for information and education only. The verdict and the entry, target and stop-loss levels are not investment advice or a solicitation to buy or sell any security. Investment decisions and their risks rest solely with the reader.
Track Visa stock price daily: live levels, support/resistance and our full Visa analysis history.