AVGO Stock Analysis: Gains 3.07%, Momentum Weakens
On November 3, 2026: price 332.13 USD, trend downtrend, RSI 44.5, support 321.68, resistance 376.51. technical analysis of avgo stock. AVGO Stock Analysis —…
Why AVGO is in focus today
- Downtrend extending (5-day change -2.98%)
Selected automatically from 100 NASDAQ (US) stocks by a technical-signal score with daily weighted randomisation — not a recommendation.
Trend & Price Action
The day’s gain did not reverse the broader pattern. Broadcom remains below its 20-day simple moving average (SMA), at $341.50, and its 50-day SMA, at $351.35. A simple moving average tracks the average closing price over a set period; trading below both suggests the recent price weakness has not yet been overcome. The 20-day average itself fell 1.60% over five days, reinforcing that the short-term trend is sloping lower. No new moving-average crossover was recorded. The stock sits in the lower portion of its 20-day range, at 19% of the distance from support to resistance. Its $321.68 support is close to the three-month low of $319.30, making that area an important test if selling resumes. On the upside, $376.51 resistance marks the 20-day ceiling; a move toward it would still need to clear the moving averages first.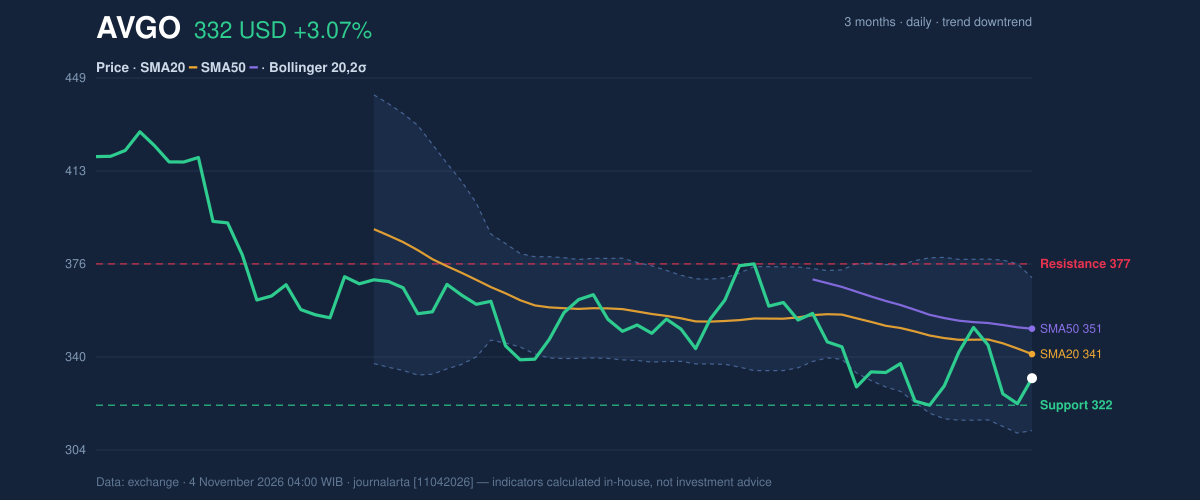
Oscillators & Momentum
Momentum readings are mixed but lean weak. The RSI is 44.5, a neutral reading; the Relative Strength Index gauges the pace of recent gains and losses, and this level does not indicate an extreme oversold condition. The Stochastic readings are also neutral, with %K at 38.8 and %D at 21.4. These measures can help identify whether a price move is gaining or losing force, but neither currently confirms a strong recovery. The MACD histogram has turned negative at -0.126, with MACD at -7.086 against a signal line of -6.960. MACD compares shorter- and longer-term price momentum; a negative histogram means the MACD line is below its signal line, a sign that momentum has weakened. The reading fits the broader downtrend rather than confirming the daily bounce.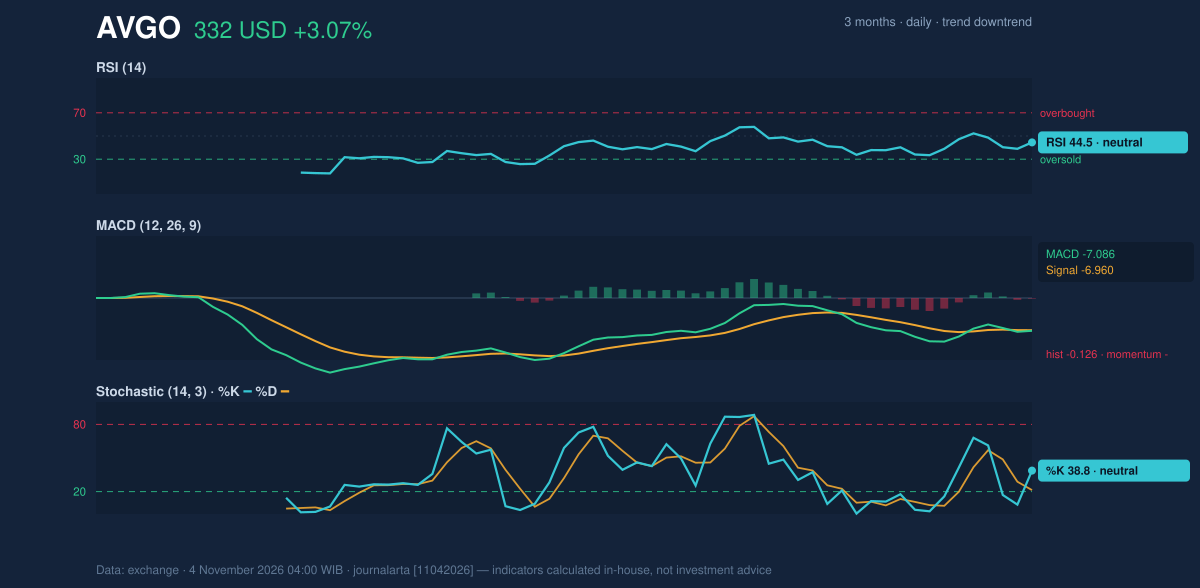
Volatility & Volume
Average True Range (ATR), a gauge of typical daily price movement, is $12.95, or 3.9% of the share price—high volatility by the supplied measure. That makes the nearby support and resistance levels more consequential, while also cautioning that moves can be sizable within a session. Trading volume was 17.12 million shares, 0.8 times the 20-day average of 21.48 million. The rise thus came on thinner-than-normal participation. On-balance volume (OBV), which accumulates volume on rising days and subtracts it on falling days, is declining. That divergence matters: the price gained, but the volume trend does not yet show stronger buying participation. The supplied technical bias is bearish, with three of seven signals bearish and none bullish.Fundamental Context
The technical weakness contrasts with strong reported results. According to its SEC filing, Broadcom reported quarterly revenue of $29.59 billion for the quarter ended 2026-08-02, up 85.5% from $15.95 billion a year earlier. According to the same filing, net income was $13.09 billion, compared with $4.14 billion a year earlier, and diluted earnings per share were $2.68. These figures provide context for the business, but they do not erase the market’s current signal: the shares remain below both moving averages, with declining OBV.Technical Verdict: SELL
The technical verdict is SELL, matching the supplied bearish bias: the price is below the SMA20 and SMA50, the MACD histogram is negative, and OBV is falling. This is a reading of the chart indicators, not an investment recommendation. The verdict is invalidated if the price falls below $321.68, the 20-day support, because that would mark a further breakdown rather than a continuation of the present range-bound setup.- Ideal Entry Range: $332.13–$341.50, from the latest price to the SMA20.
- Exit Target: $321.68, the 20-day support; the next reference below it is the three-month low at $319.30.
- Stop Loss: $351.55, the price-plus-1.5-ATR reference.
| Metric | Reading |
|---|---|
| Latest price | $332.13 |
| Change | 1 day: 3.07% | 5 days: -2.98% | 1 month: -11.62% |
| SMA20 / SMA50 | $341.50 / $351.35 |
| Support / resistance | $321.68 / $376.51 |
| RSI / Stochastic | 44.5 / %K 38.8, %D 21.4 |
| MACD histogram / ATR | -0.126 / $12.95 |
| Volume / 20-day average | 17,120,000 / 21,479,700 |
Summary Data AVGO
| Last price | 332.13 USD |
| Change 1 day / 5 days / 1 month | 3.07% / -2.98% / -11.62% |
| Trend / MA-cross | downtrend / none |
| SMA20 / SMA50 | 341.50 / 351.35 |
| RSI (14) / Stochastic %K | 44.5 / 38.8 |
| Bollinger %B / ATR | 34% / 12.95 |
| Support / Resistance 20 days | 321.68 / 376.51 |
| Data as of | 4 November 2026 04:00 WIB |
Disclaimer: This technical analysis is generated automatically from exchange data and indicators calculated by JournalArta, for information and education only. The verdict and the entry, target and stop-loss levels are not investment advice or a solicitation to buy or sell any security. Investment decisions and their risks rest solely with the reader.
Track AVGO stock price daily: live levels, support/resistance and our full AVGO analysis history.