Golden Cross Formed, NKE Stock Drops 1.64% on Tuesday
On November 3, 2026: price 38.48 USD, trend uptrend, RSI 58.6, support 34.36, resistance 39.12. technical analysis of nke stock. Golden Cross Formed — full…

Why NKE is in focus today
- Fresh golden cross: SMA20 crossed above SMA50
- Uptrend confirmed (5-day change 2.45%)
Selected automatically from 80 NYSE (US) stocks by a technical-signal score with daily weighted randomisation — not a recommendation.
Trend & Price Action
The shares are in the upper portion of their recent range: at 87% of the 20-day range, with resistance at $39.12 and support at $34.36. They are also below the three-month high of $42.64 and above the three-month low of $31.97. The structure therefore shows recovery, but also places the stock close to a near-term hurdle. As shown in the chart, the price is above its rising 20-day average, while the 20-day average has just moved over the 50-day line. That combination supports the bullish technical bias. But a close above $39.12 would be a more convincing test of whether buyers can carry the move beyond the current range.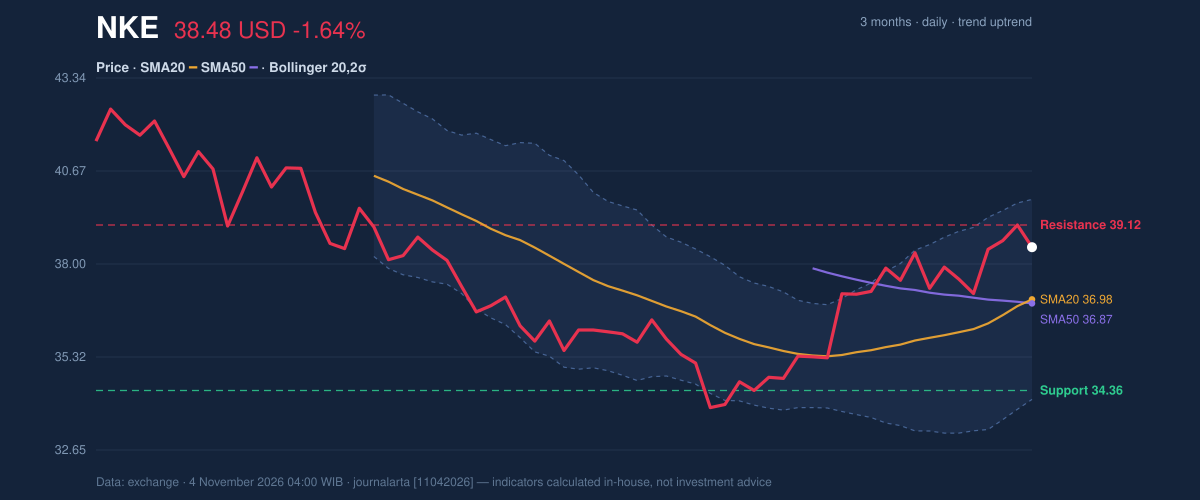
Oscillators & Momentum
Momentum indicators are positive without pointing to an extreme. The RSI is 58.6, in neutral territory, suggesting improving strength but not a market condition typically described as overbought. The Stochastic is also neutral, with %K at 70.0 and %D at 82.7; the gap between the readings tempers the bullish signal and shows that short-term momentum is not uniformly strong. The MACD is positive at 0.585, above its 0.334 signal line, with a positive 0.251 histogram. In plain terms, the faster-moving momentum measure is above its reference line, consistent with the rising trend. As shown in the momentum chart, these readings support the trend rather than independently confirming a breakout.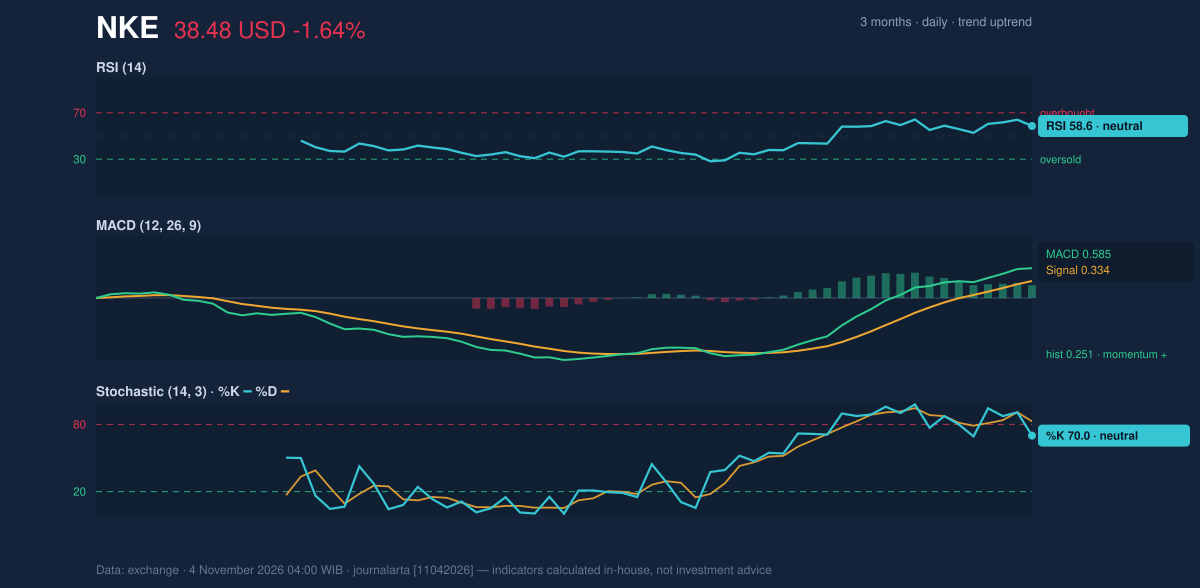
Volatility & Volume
The Bollinger Bands—an indicator that maps price against a moving average and its volatility range—are at normal width, not compressed into a tight “squeeze” that might precede a sharper move. The %B reading of 76% places the price in the upper portion of the band, but not at the upper boundary of $39.86. That leaves room for movement in either direction while underscoring the nearby resistance. Average true range, a measure of typical price movement, is $1.08, or 2.8% of the share price, indicating moderate volatility. Volume was 18,051,800 shares, about 0.7 times its 20-day average of 25,998,515. This thin participation makes the latest decline less conclusive as evidence of broad selling pressure, but it also means the golden cross has not yet been accompanied by stronger-than-usual trading. OBV, which tracks whether volume generally flows into or out of a stock, is rising—another supportive signal.Fundamental Context
The technical picture is improving while Nike’s latest reported quarter remained softer year over year. According to its SEC filing, revenue for the quarter ended August 31, 2026 was $11.21 billion, down 4.3% from $11.72 billion a year earlier. Net income was $712.0 million, compared with $727.0 million, and diluted earnings per share were $0.48. Those results do not negate the chart signals, but they show that a strengthening share-price trend is unfolding alongside weaker reported revenue and slightly lower net income.Technical Verdict: BUY
The bullish classification follows the supplied technical bias, not the company’s fundamentals. The strongest supporting signals are the golden cross on the latest session, the price holding above both moving averages within an uptrend, and rising OBV. Neutral RSI and Stochastic readings, low relative volume, and resistance near $39.12 remain reasons for caution rather than evidence of a confirmed breakout. The verdict is invalidated if the price falls below the 20-day support at $34.36. - Entry range: $36.98–$39.12, spanning the 20-day average to 20-day resistance. - Exit target: $42.64, the three-month high and the next listed resistance beyond $39.12. - Stop-loss protection: $34.36, below the 20-day support. For non-traders, the chart currently favors further strength, but that reading weakens if the shares lose support or cannot clear nearby resistance.Summary Data NKE
| Last price | 38.48 USD |
| Change 1 day / 5 days / 1 month | -1.64% / 2.45% / 11.18% |
| Trend / MA-cross | uptrend / golden |
| SMA20 / SMA50 | 36.98 / 36.87 |
| RSI (14) / Stochastic %K | 58.6 / 70.0 |
| Bollinger %B / ATR | 76% / 1.08 |
| Support / Resistance 20 days | 34.36 / 39.12 |
| Data as of | 4 November 2026 04:00 WIB |
Disclaimer: This technical analysis is generated automatically from exchange data and indicators calculated by JournalArta, for information and education only. The verdict and the entry, target and stop-loss levels are not investment advice or a solicitation to buy or sell any security. Investment decisions and their risks rest solely with the reader.
Track NKE stock price daily: live levels, support/resistance and our full NKE analysis history.