IBM Stock Drops 0.98% on Tuesday, Golden Cross Formed
On November 3, 2026: price 250.04 USD, trend uptrend, RSI 59.3, support 220.51, resistance 258.28. technical analysis of ibm stock. IBM Stock Drops — full…
Why IBM is in focus today
- Fresh golden cross: SMA20 crossed above SMA50
Selected automatically from 80 NYSE (US) stocks by a technical-signal score with daily weighted randomisation — not a recommendation.
Trend & Price Action
IBM remains in an uptrend: its price is above both the 20-day simple moving average (SMA20) at $241.86 and the 50-day average (SMA50) at $235.88. The SMA20 has risen 3.44% over five days, indicating that the near-term trend is strengthening rather than merely tracking the latest price move. A golden cross—when the shorter-term average moves above the longer-term one—formed four sessions before the latest session. It supports the bullish structure, but its timing means it is not a signal formed on Tuesday. The price is 78% of the way through its 20-day range, closer to resistance at $258.28 than support at $220.51. It is also nearing the three-month high of $259.87, a zone where gains could meet selling pressure. The pullback has not broken the uptrend while IBM holds above its moving averages, but the nearby resistance makes follow-through important.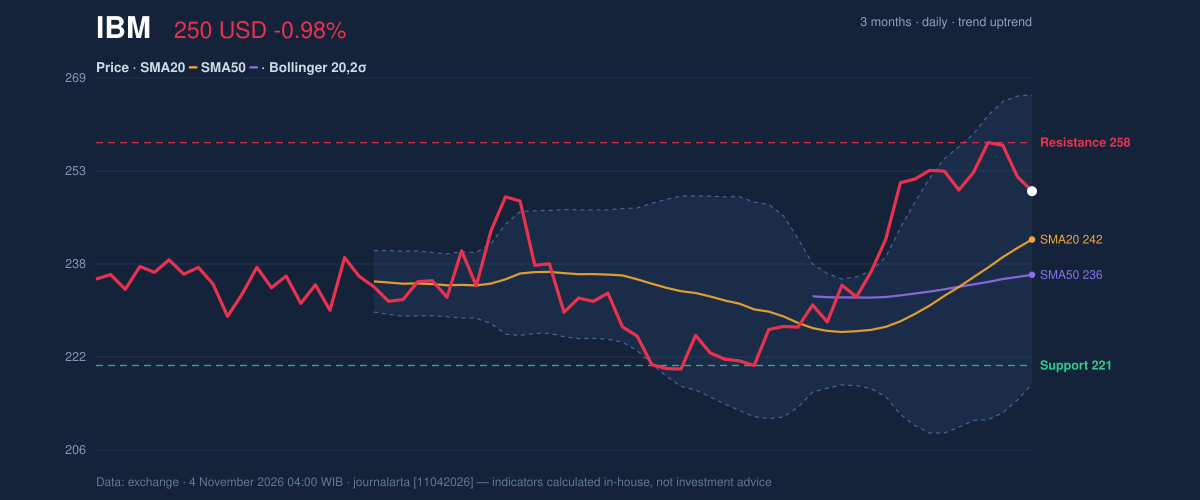
Oscillators & Momentum
Momentum indicators are broadly supportive, though not uniformly strong. The RSI is 59.3, in neutral territory, suggesting the shares are neither deeply oversold nor at an extreme overbought reading. The Stochastic readings are also classified as neutral, with %K at 71.0 and %D at 81.3; the lower %K relative to %D can signal that immediate momentum has cooled. The MACD line is above its signal line, with a positive histogram of 1.026. That configuration indicates positive momentum remains in place, even as the technical-bias data flags the RSI as rolling over from above 65. In plain terms, the broader advance still has momentum behind it, but the latest move is less forceful than the preceding climb.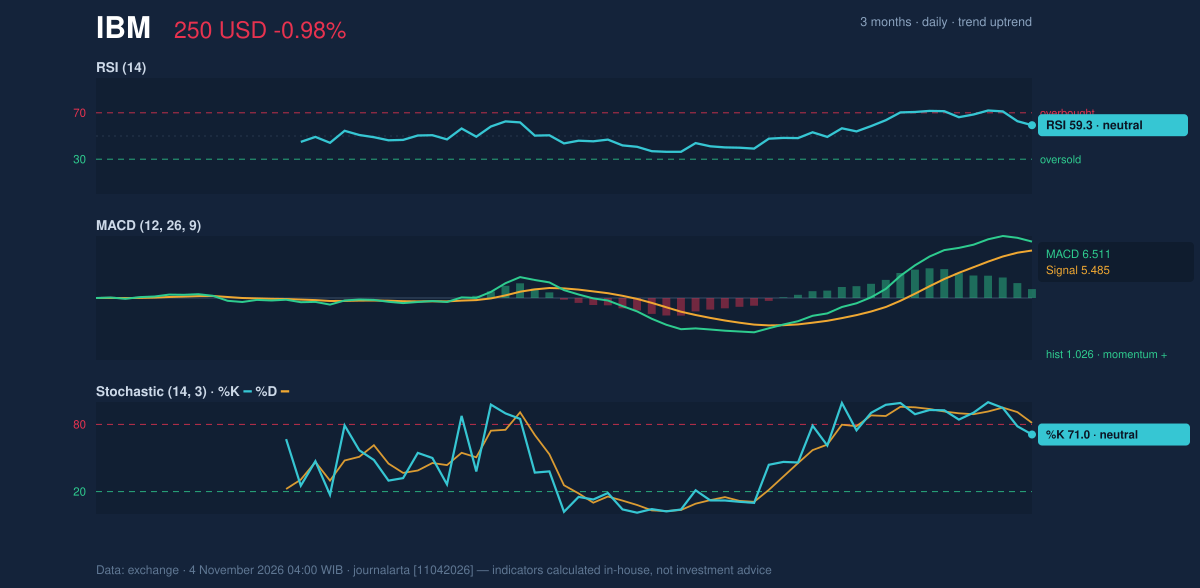
Volatility & Volume
IBM’s Bollinger Bands are widening, a sign that price swings have increased. The shares sit at 67% of the distance between the lower and upper bands, with the upper band at $266.35 and the lower at $217.36. The widening bands point to elevated volatility, not a directional forecast on their own. The average true range (ATR), a measure of typical price movement, is $8.01, or 3.2% of the share price, consistent with moderate day-to-day volatility. Volume was 3,435,900 shares, around 0.6 times the 20-session average of 5,431,320. That below-average participation makes the latest pullback less conclusive as evidence of a broad shift in investor positioning. On balance volume (OBV), which tracks whether volume tends to accompany rising or falling prices, is rising—a further sign that participation has supported the broader trend.Fundamentals & Technical Verdict
According to its SEC filing, IBM reported quarterly revenue of $17.10 billion for the quarter ended September 30, 2026, up 4.7% from $16.33 billion a year earlier. Net income was $2.19 billion, compared with $1.74 billion, and diluted earnings per share were $2.30. The company filed its quarterly results with the SEC on October 22. The results add fundamental context, but they do not determine the technical verdict below.Technical Verdict: BUY
The required technical bias is bullish, supported by the golden cross formed four sessions earlier, price above the SMA20 and SMA50, and rising OBV. Positive MACD momentum adds confirmation. The main caution is the RSI rollover flagged in the signal data, alongside the nearby resistance zone. - Ideal entry range: $241.86 (SMA20) to $250.04, where the price is currently above its short-term average. - Exit target: $258.28, the 20-day resistance; if price moves above that level, the next reference is the three-month high at $259.87. - Stop-loss protection: $238.03, the price-minus-1.5-ATR reference; the 20-day support at $220.51 is a deeper structural level. - Invalidation: the bullish verdict is invalidated if the price falls below $238.03. For non-traders, the indicators favor an upward trend, but the shares are approaching a level where that advance may stall.Summary Data IBM
| Last price | 250.04 USD |
| Change 1 day / 5 days / 1 month | -0.98% / -0.08% / 12.99% |
| Trend / MA-cross | uptrend / golden |
| SMA20 / SMA50 | 241.86 / 235.88 |
| RSI (14) / Stochastic %K | 59.3 / 71.0 |
| Bollinger %B / ATR | 67% / 8.01 |
| Support / Resistance 20 days | 220.51 / 258.28 |
| Data as of | 4 November 2026 04:00 WIB |
Disclaimer: This technical analysis is generated automatically from exchange data and indicators calculated by JournalArta, for information and education only. The verdict and the entry, target and stop-loss levels are not investment advice or a solicitation to buy or sell any security. Investment decisions and their risks rest solely with the reader.
Track IBM stock price daily: live levels, support/resistance and our full IBM analysis history.