ORCL Stock Technicals: Gains 5.85% on Tuesday, Momentum Weakens
On November 3, 2026: price 126.19 USD, trend downtrend, RSI 44.1, support 119.22, resistance 144.54. technical analysis of orcl stock. ORCL Stock Technicals —…

Why ORCL is in focus today
- Volume at 2.3× the 20-day average
- Downtrend extending (5-day change -3.32%)
Selected automatically from 80 NYSE (US) stocks by a technical-signal score with daily weighted randomisation — not a recommendation.
Trend & Price Action
The closing price remained below the 20-day simple moving average (SMA) of $132.64 and the 50-day average of $140.93. The 20-day average itself fell 1.66% over five days, reinforcing the downtrend rather than confirming a recovery. No new moving-average crossover was recorded. In plain terms, the day’s gain has not yet shifted the stock’s broader price structure. Oracle traded at 28% of its 20-day range, closer to support than resistance. The immediate floor is $119.22, while resistance stands at $144.54. The three-month range, from $118.43 to $170.70, shows how far the stock has retreated from its recent high—and how close the current price is to the period’s low. The session’s rebound is notable, but it has not reclaimed the falling 20-day average.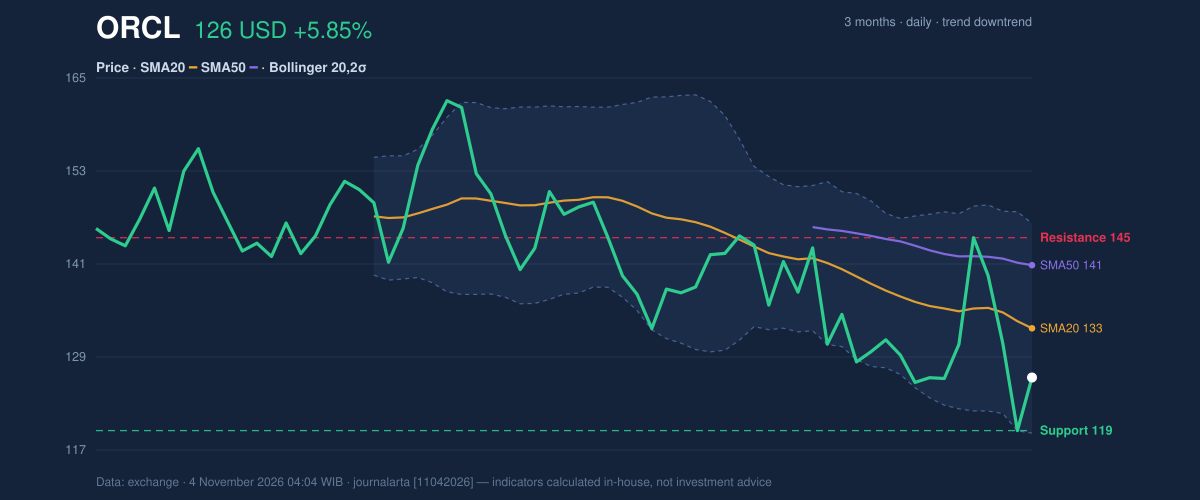
Oscillators & Momentum
Momentum indicators are mixed, but the stronger directional signal remains negative. The RSI, which gauges the pace of recent gains and losses, was neutral at 44.1; it neither indicates an oversold extreme nor confirms strong upward momentum. The Stochastic readings were also neutral, with %K at 25.8 and %D at 19.7, near the lower part of their scale but not, on the supplied classification, a confirmed reversal signal. The MACD histogram had turned negative at -0.178, with MACD at -3.482 against a -3.303 signal line. A negative histogram means the shorter-term momentum measure is weaker than its signal line. Combined with falling OBV and a price still below the 50-day average, the indicators do not yet show broad confirmation of the one-day bounce.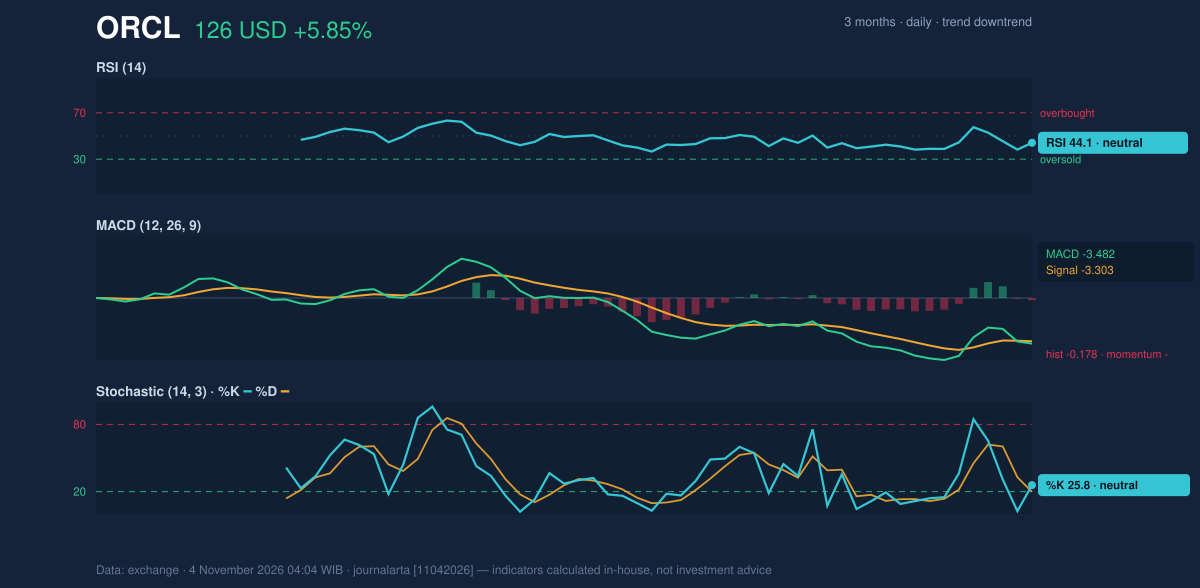
Volatility & Key Levels
The Bollinger Bands are widening, a sign that price swings have become larger rather than calmer. The band width was 20.7%, and the stock’s position at 27% of the band range left it in the lower portion of the envelope. The $118.89 lower band sits close to the $119.22 support level, making that area an important near-term test. A sustained break below $119.22 would put the three-month low of $118.43 in view; holding support would be necessary for the rebound to gain credibility. Volatility cuts both ways. Average True Range (ATR), a measure of typical price movement, was $7.94, or 6.3% of the share price. That elevated reading means moves around technical levels may be wide, so a brief breach is not necessarily the same as a decisive trend break. On the upside, the first major test is the 20-day average at $132.64, followed by resistance at $144.54.Fundamental Context
The technical weakness contrasts with strong reported growth. According to its SEC filing, Oracle recorded quarterly revenue of $19.35 billion for the quarter ended August 31, 2026, up 29.6% from $14.93 billion a year earlier. Net income was $4.76 billion, compared with $2.93 billion, and diluted earnings per share were $1.56. Oracle also filed a Form 8-K with the U.S. Securities and Exchange Commission on October 28, reporting a Regulation FD disclosure. Those filings provide company context, but they do not change the price-based signals for the session.Technical Verdict: SELL
The supplied technical bias is bearish. Three signals support that reading: the MACD histogram is negative, the price remains below its 50-day average while the trend is down, and OBV is falling despite the volume surge. The sharp daily gain is a counter-move, not yet a confirmed trend reversal. - Ideal Entry Range: $132.64–$144.54, the 20-day average to 20-day resistance, as a conditional area to assess whether a rebound fails. - Exit Target: $119.22, the 20-day support; $118.43 is the next reference if that support breaks. - Stop Loss: $144.54, above the 20-day resistance; the supplied volatility reference is $138.10, price plus 1.5 times ATR. - Invalidation: The bearish verdict is invalidated if price breaks above $144.54. For non-traders, this verdict means the indicators still favor downside risk, although the unusually active rebound makes support and resistance especially important. | Indicator | Reading | |---|---:| | Last price | $126.19 | | One-day / five-day / one-month change | +5.85% / -3.32% / -12.83% | | SMA20 / SMA50 | $132.64 / $140.93 | | RSI(14) | 44.1 | | Support / resistance (20-day) | $119.22 / $144.54 | | ATR(14) | $7.94 |Summary Data ORCL
| Last price | 126.19 USD |
| Change 1 day / 5 days / 1 month | 5.85% / -3.32% / -12.83% |
| Trend / MA-cross | downtrend / none |
| SMA20 / SMA50 | 132.64 / 140.93 |
| RSI (14) / Stochastic %K | 44.1 / 25.8 |
| Bollinger %B / ATR | 27% / 7.94 |
| Support / Resistance 20 days | 119.22 / 144.54 |
| Data as of | 4 November 2026 04:04 WIB |
Disclaimer: This technical analysis is generated automatically from exchange data and indicators calculated by JournalArta, for information and education only. The verdict and the entry, target and stop-loss levels are not investment advice or a solicitation to buy or sell any security. Investment decisions and their risks rest solely with the reader.
Track ORCL stock price daily: live levels, support/resistance and our full ORCL analysis history.