QCOM Stock Gains 1.45% on Tuesday, Death Cross Pressure
On November 3, 2026: price 164.43 USD, trend downtrend, RSI 39.6, support 162.08, resistance 185.41. technical analysis of qcom stock. QCOM Stock Gains — full…

Qualcomm fell into a fresh technical downtrend on Nasdaq, with the chipmaker’s shares closing at $164.43 on Tuesday, November 3, 2026, even after a one-day gain of 1.45%. The rebound sits against a sharp five-session slide of 10.72% and a death cross formed two sessions earlier, when the 20-day moving average moved below the 50-day average. That combination makes the stock’s small daily advance look more like a pause than a confirmed reversal.
Why QCOM is in focus today
- Fresh death cross: SMA20 crossed below SMA50
- Downtrend extending (5-day change -10.72%)
Selected automatically from 100 NASDAQ (US) stocks by a technical-signal score with daily weighted randomisation — not a recommendation.
Trend & Price Action
Qualcomm’s price remains below both its 20-day average of $175.12 and its 50-day average of $177.98. The 20-day average itself fell 1.49% over five days, showing that the weakness is embedded in the short-term trend rather than limited to a single session. With the share price near the bottom of its 20-day range, the market is testing whether buyers will defend the recent floor.
The lower Bollinger Band, a statistical boundary that tracks price movement around its average, stands at $163.19; the stock’s %B reading of 5% places it close to that lower edge. This can indicate intense selling pressure, though proximity to the band alone does not establish that a rebound is due. The band width is normal at 13.6%, rather than unusually narrow or expanded. As shown in the chart, the key context is the gap between price and the declining moving averages.
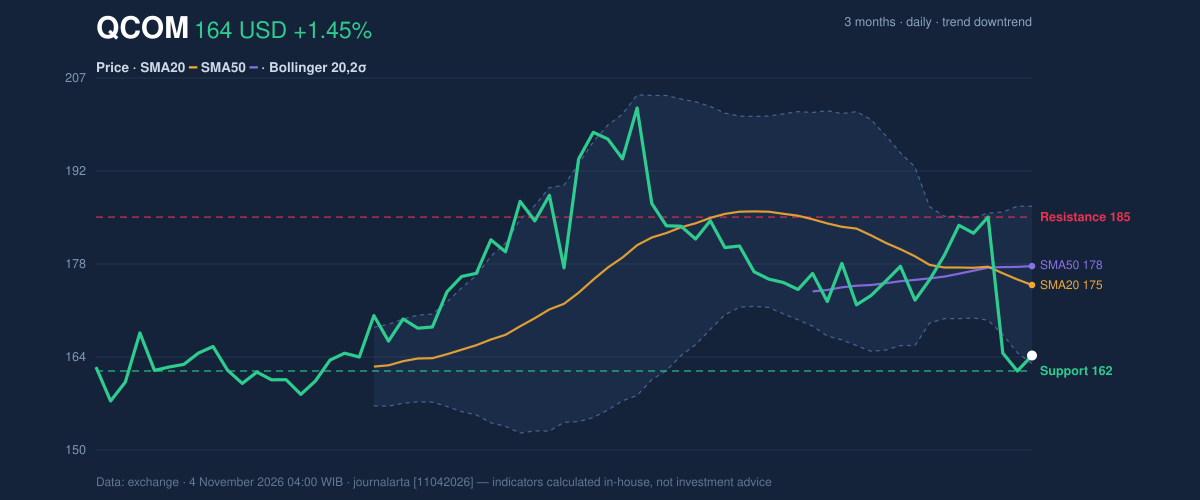
The nearest 20-day support is $162.08, while resistance is $185.41. The three-month range runs from $155.22 to $205.85, leaving the share price in the lower portion of its broader trading range. A sustained break below support would put the three-month low in focus; failure to reclaim the moving-average area would leave the downtrend intact.
Oscillators & Momentum
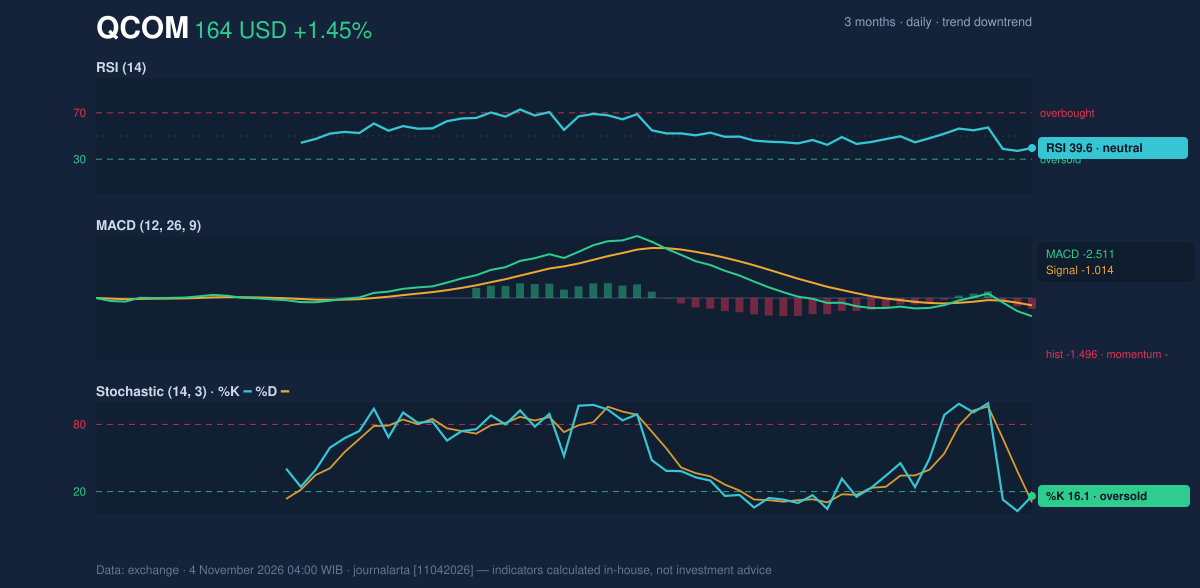
Momentum indicators are mixed in a way that favors caution. The RSI is 39.6, a neutral reading, so it does not yet show the deeply depressed momentum often associated with a clear oversold signal. The Stochastic readings—%K at 16.1 and %D at 10.5—are oversold, suggesting the recent drop has been rapid. That condition can precede a short-lived bounce, but it is not confirmation that the broader trend has turned.
The MACD is negative at -2.511, with its histogram at -1.496, pointing to downside momentum. In plain terms, the short-term trend remains weaker than the longer-term reference line used by the indicator. The one-day rise has therefore not yet been matched by a shift in momentum.
Volatility & Volume
Average true range, which estimates typical daily movement, is $7.37, or 4.5% of the share price—a high level of volatility. That makes nearby support and resistance important reference points, while also meaning price can move materially within a session. Trading volume was 11,401,300 shares, or 1.1 times the 20-session average, so the decline has not occurred on especially thin participation. On-balance volume, which tracks whether volume flows are accumulating or distributing, is falling, adding evidence that trading activity has not yet confirmed a durable recovery.
Fundamental Context
According to its SEC filing, Qualcomm reported quarterly revenue of $9.95 billion for the quarter ended June 28, 2026, down 4.0% from $10.37 billion a year earlier. Net income was $2.00 billion, compared with $2.67 billion in the prior-year quarter, and diluted earnings per share were $1.87. Those figures provide a weaker earnings backdrop, while the verdict below remains based on the technical signals.
Technical Verdict: SELL
The technical bias is bearish, with four of seven signals bearish and none bullish. The strongest evidence is the death cross formed two sessions before the latest session, the negative MACD histogram, and falling OBV alongside a price still below both moving averages. Oversold Stochastic readings warn that a temporary bounce is possible, but do not yet overturn those signals.
- Entry range: $163.19–$175.12, bounded by the lower Bollinger Band and the 20-day average.
- Exit target: $162.08 at 20-day support; if that level gives way, the next reference is the three-month low of $155.22.
- Stop-loss protection: Above $185.41, the 20-day resistance level.
The bearish reading would be invalidated if Qualcomm rises above $185.41. For non-traders, the indicators currently show more evidence of persistent selling than of a confirmed recovery.
Summary Data QCOM
| Last price | 164.43 USD |
| Change 1 day / 5 days / 1 month | 1.45% / -10.72% / -9.17% |
| Trend / MA-cross | downtrend / death |
| SMA20 / SMA50 | 175.12 / 177.98 |
| RSI (14) / Stochastic %K | 39.6 / 16.1 |
| Bollinger %B / ATR | 5% / 7.37 |
| Support / Resistance 20 days | 162.08 / 185.41 |
| Data as of | 4 November 2026 04:00 WIB |
Disclaimer: This technical analysis is generated automatically from exchange data and indicators calculated by JournalArta, for information and education only. The verdict and the entry, target and stop-loss levels are not investment advice or a solicitation to buy or sell any security. Investment decisions and their risks rest solely with the reader.
Track QCOM stock price daily: live levels, support/resistance and our full QCOM analysis history.