Momentum Weakens, XOM Stock Drops 1.23% on Tuesday
On November 3, 2026: price 177.46 USD, trend uptrend, RSI 53.5, support 164.05, resistance 187.25. technical analysis of xom stock. Momentum Weakens — full…

Why XOM is in focus today
- MACD histogram has just turned negative
- Not covered by JournalArta in the last 14 days
Selected automatically from 80 NYSE (US) stocks by a technical-signal score with daily weighted randomisation — not a recommendation.
Trend & Price Action
The pullback leaves XOM close to its 20-day moving average at $177.41, while the price remains well above its 50-day average at $168.32. The 20-day average rose 2.62% over five days, a sign that the intermediate trend is still climbing even as the share price slipped 1.36% over that period. Over one month, however, XOM is up 7.89%. No new moving-average crossover has formed. That combination points to a pause within an uptrend rather than clear evidence of a trend reversal. The price sits at 58% of its 20-day range, between support at $164.05 and resistance at $187.25. The three-month range extends from $149.09 to $188.50, putting the nearby resistance close to the period high. The price is testing its rising 20-day average while remaining above the 50-day average, so holding this area would preserve the current uptrend structure. The chart shows the relationship between price, moving averages, Bollinger bands, and key levels.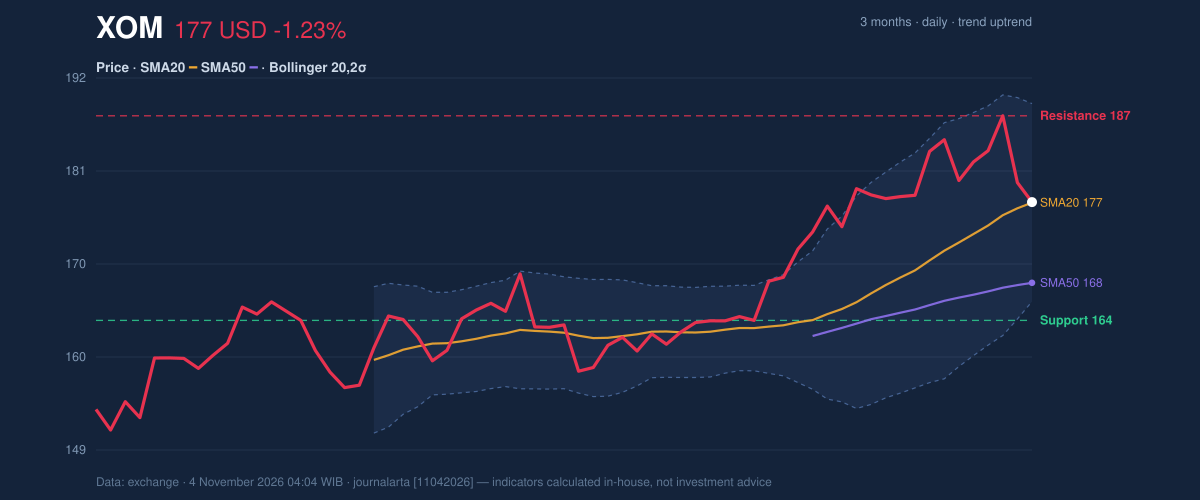
Oscillators & Momentum
Momentum is mixed rather than uniformly weak. The RSI is neutral at 53.5, indicating neither an oversold condition nor strong buying pressure. The Stochastic readings—%K at 25.9 and %D at 52.9—are also classified as neutral, though the gap between them suggests recent price momentum has cooled. The clearer caution comes from the MACD. Its value of 4.213 is below the 4.553 signal line, leaving a negative histogram of -0.340. That turn does not erase the longer trend, but it signals that upward momentum has weakened and needs to stabilize if the stock is to retest resistance. The technical-bias assessment also flags the RSI as rolling over from above 65.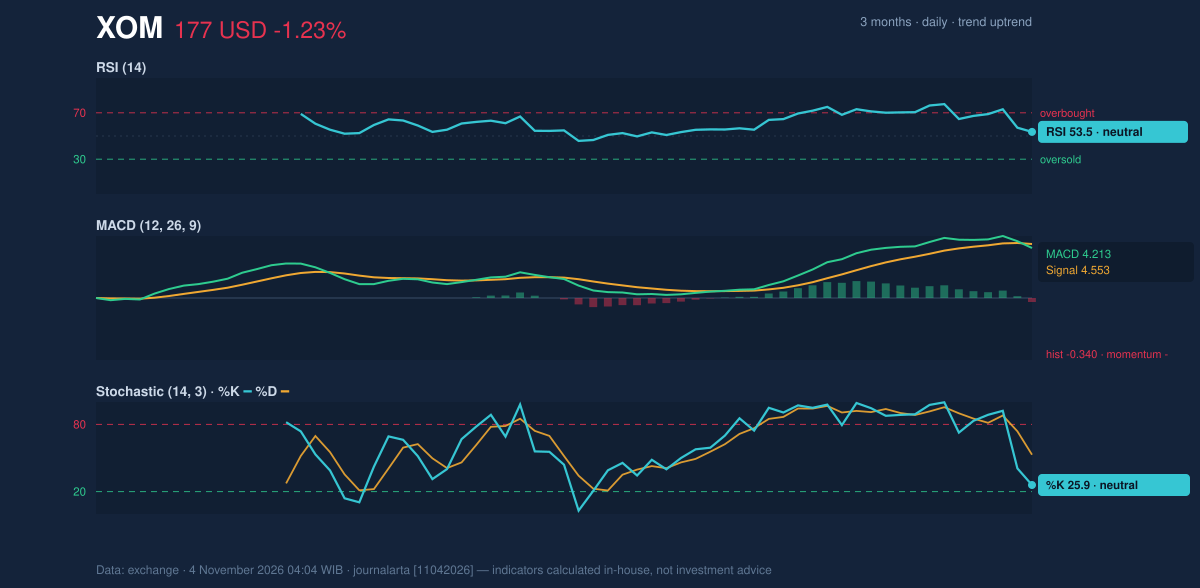
Volatility & Volume
The Bollinger reading places XOM near the middle of its band: %B is 50%, with the center at $177.41 and the upper and lower bands at $188.63 and $166.19. The bands’ 12.6% width is normal, not unusually tight or expanded. In plain terms, the data show neither a compressed setup suggesting an imminent burst of movement nor a volatility surge already underway. The 14-day ATR is $4.46, or 2.5% of the share price, consistent with moderate volatility. Volume was 11,559,900 shares, or 0.9 times the 20-day average. That below-average turnover makes the decline less conclusive as a broad rush to exit; rising OBV, a measure that tracks whether volume is flowing more with advances or declines, provides a counterweight by indicating accumulation over the measured period.Key Levels & Scenarios
The first test is whether XOM can hold around its 20-day average of $177.41. A sustained move back above that average would help address the MACD weakness, while a break toward $187.25 would bring the three-month high of $188.50 into focus. On the downside, failure to hold the average could expose the lower Bollinger band at $166.19, with the 20-day support at $164.05 marking the more important range floor. The balance of evidence is neutral: rising OBV and the price’s position above the 50-day average support the trend, but the negative MACD histogram and cooling RSI argue against treating the pullback as resolved.Fundamental Context
According to its SEC filing, ExxonMobil reported quarterly revenue of $113.16 billion for the quarter ended September 30, 2026, up 32.7% from $85.29 billion a year earlier. Net income was $15.41 billion, compared with $7.55 billion a year earlier, and diluted earnings per share were $3.72. The company filed a Form 8-K with the SEC on October 30 reporting results of operations and financial condition and a Regulation FD disclosure. Those results provide business context, but the technical verdict below follows the mixed price and momentum signals.Technical Verdict: HOLD
HOLD (wait & see) matches the neutral technical bias. The strongest reasons are the price holding above the 50-day average with the 20-day average rising, and OBV continuing to rise; against those signals, the MACD histogram has turned negative at -0.340 and the RSI is rolling over from above 65. The verdict is invalidated if price falls below the 20-day support at $164.05.- Ideal entry range: $177.41–$170.76, using the 20-day average and the price-minus-1.5-ATR reference.
- Exit target: $187.25, the 20-day resistance level.
- Stop-loss protection: Below $164.05, the 20-day support.
| Data | Reading |
|---|---|
| Last price | $177.46 |
| Change | 1 day: -1.23% | 5 days: -1.36% | 1 month: +7.89% |
| SMA20 / SMA50 | $177.41 / $168.32 |
| RSI / Stochastic | 53.5 / %K 25.9, %D 52.9 |
| MACD / signal / histogram | 4.213 / 4.553 / -0.340 |
| Support / resistance | $164.05 / $187.25 |
| Three-month high / low | $188.50 / $149.09 |
Summary Data XOM
| Last price | 177.46 USD |
| Change 1 day / 5 days / 1 month | -1.23% / -1.36% / 7.89% |
| Trend / MA-cross | uptrend / none |
| SMA20 / SMA50 | 177.41 / 168.32 |
| RSI (14) / Stochastic %K | 53.5 / 25.9 |
| Bollinger %B / ATR | 50% / 4.46 |
| Support / Resistance 20 days | 164.05 / 187.25 |
| Data as of | 4 November 2026 04:04 WIB |
Disclaimer: This technical analysis is generated automatically from exchange data and indicators calculated by JournalArta, for information and education only. The verdict and the entry, target and stop-loss levels are not investment advice or a solicitation to buy or sell any security. Investment decisions and their risks rest solely with the reader.
Track XOM stock price daily: live levels, support/resistance and our full XOM analysis history.