ST Engineering Stock Technicals: Gains 0.51% on Wednesday, Testing Support Level
On November 4, 2026: price 9.88 SGD, trend downtrend, RSI 30.8, support 9.83, resistance 10.51. technical analysis of st engineering stock.
Trend & Price Action
ST Engineering’s share price remains below its 20-day moving average of S$10.24 and its 50-day average of S$10.46, a configuration consistent with the reported downtrend. The 20-day average itself fell 2.53% over five days, showing that the weakness is not confined to a single session. There was no new moving-average crossover, so there is no fresh technical signal of a trend reversal. The stock sits near the bottom of its recent range: its 20-day support is S$9.83, compared with resistance at S$10.51, while the three-month range runs from S$9.71 to S$11.29. That leaves limited distance to the lower end of the range, but proximity to a low alone does not establish that selling has run its course. The daily rise is a pause, not yet a confirmed recovery. The closing price was only slightly above the S$9.83 support level, while remaining below both moving averages. As shown in the chart, the price is pressing the lower Bollinger band, with the averages and marked support and resistance levels providing context for whether it can regain lost ground.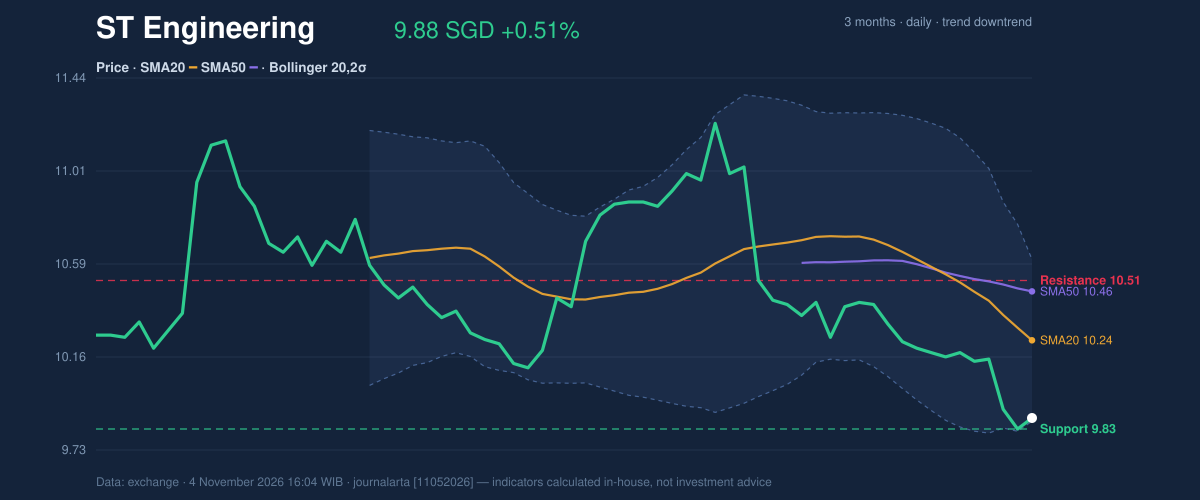
Oscillators & Momentum
Momentum indicators are mixed rather than clearly pointing to a reversal. The relative strength index (RSI), which gauges the pace of recent price changes, stands at 30.8 and is classified as neutral in the supplied data. The stochastic readings are also neutral, with %K at 21.5 and %D at 21.1. Their low readings show weak recent momentum, but the neutral classification does not confirm a rebound. The moving average convergence divergence (MACD), a measure of trend momentum, remains negative at -0.173, below its -0.129 signal line, with a -0.045 histogram. MACD therefore continues to confirm downward momentum rather than a bullish turn. The momentum chart puts those readings alongside the price trend: a change in direction would need evidence beyond the current session’s gain.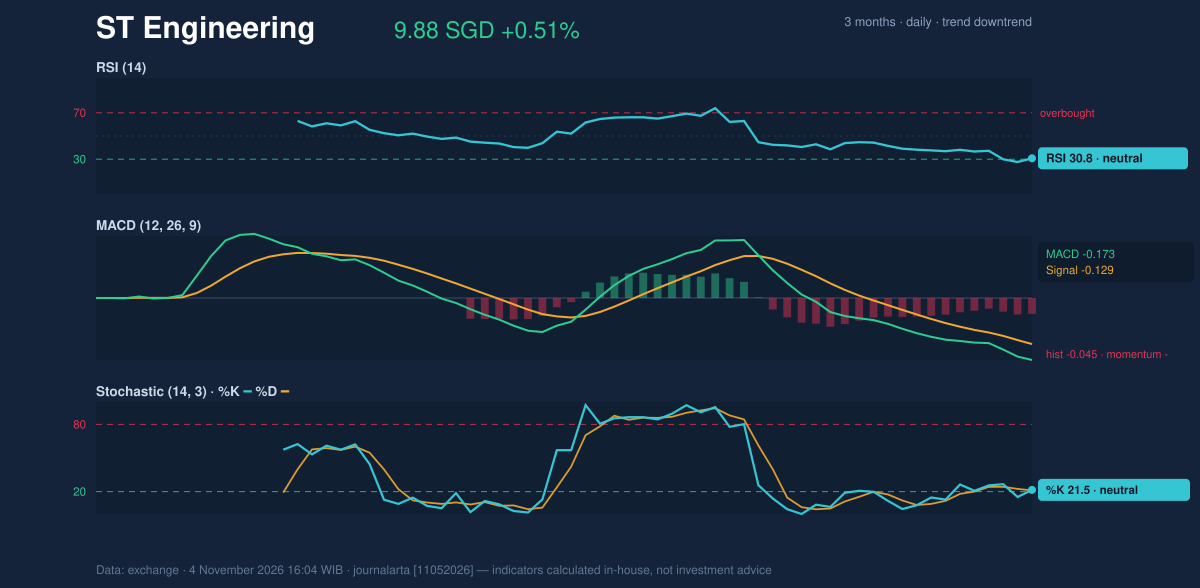
Volatility & Volume
Bollinger bands, which track price relative to a recent average and its fluctuations, are narrowing. The band width is 7.2%, and the price sits at just 2% of the distance from the lower to the upper band, with the lower band at S$9.87. The squeeze signals that volatility has contracted and a larger move may follow, but it does not say which direction that move will take. Trading volume reached 4,623,100 shares, or 1.1 times the 20-day average of 4,164,507. That above-average activity gives the decline more significance than a move on especially thin trading would have. OBV, which tracks whether volume is accumulating on rising days or falling on declining days, is also down. The supplied technical assessment identifies that falling OBV as confirmation of the downtrend. The average true range (ATR), a measure of typical price movement, is S$0.21, or 2.1% of the share price, indicating moderate volatility. In practical terms, near-term fluctuations can still be material even as the bands tighten.Key Levels & Scenarios
S$9.83 is the immediate support to watch, with the three-month low at S$9.71 below it. A sustained move beneath those levels would extend the weakness; a hold could give the shares room to stabilise, but would not by itself erase the broader downtrend. On the upside, S$10.24 is the 20-day average and S$10.51 is resistance. Regaining those levels would offer stronger evidence that sellers are losing control.Technical Verdict: HOLD
The technical bias is neutral, so the verdict is HOLD (wait & see), not a directional call. The reasons are the downtrend, with price below both the 20-day and 50-day averages; negative MACD at -0.173 against a -0.129 signal line; and falling OBV, which confirms selling pressure. The squeeze adds the possibility of a sharper move but provides no directional confirmation. The verdict is invalidated if the price falls below S$9.71, the three-month low.- Ideal entry range: S$9.83–S$10.24, bounded by 20-day support and the 20-day average.
- Exit target: S$10.51, the 20-day resistance.
- Stop-loss protection: S$9.57, the supplied price-minus-1.5-times-ATR level.
Technical analysis is not an investment recommendation.
Why ST Engineering is in focus today
- Trading near its 3-month low (9.71)
- Downtrend extending (5-day change -2.95%)
Selected automatically from 32 SGX (Singapore) stocks by a technical-signal score with daily weighted randomisation — not a recommendation.
Summary Data ST Engineering
| Last price | 9.88 SGD |
| Change 1 day / 5 days / 1 month | 0.51% / -2.95% / -10.43% |
| Trend / MA-cross | downtrend / none |
| SMA20 / SMA50 | 10.24 / 10.46 |
| RSI (14) / Stochastic %K | 30.8 / 21.5 |
| Bollinger %B / ATR | 2% / 0.21 |
| Support / Resistance 20 days | 9.83 / 10.51 |
| Data as of | 4 November 2026 16:04 WIB |
Disclaimer: This technical analysis is generated automatically from exchange data and indicators calculated by JournalArta, for information and education only. The verdict and the entry, target and stop-loss levels are not investment advice or a solicitation to buy or sell any security. Investment decisions and their risks rest solely with the reader.
Track ST Engineering share price daily: live levels, support/resistance and our full ST Engineering analysis history.