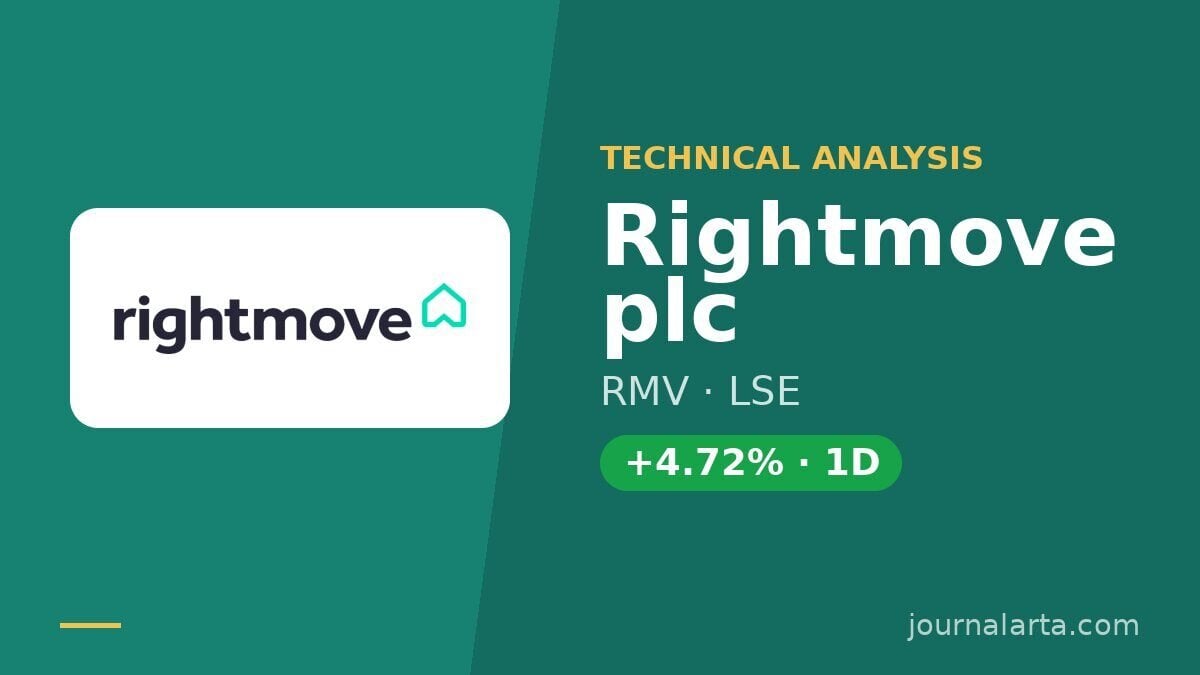
Rightmove Stock Gains 4.72%, Testing Key Resistance In Focus
On November 4, 2026: price 563.80 GBp, trend uptrend, RSI 65.9, support 490.50, resistance 563.80. technical analysis of rightmove stock.
Why Rightmove is in focus today
- One-day move of 4.72%, about 1.4× its average daily range (ATR)
- Closed at a 20-day high (563.80)
- Trading near its 3-month high (565.20)
- MACD histogram has just turned positive
- Uptrend confirmed (5-day change 10.85%)
- Not covered by JournalArta in the last 14 days
Selected automatically from 98 LSE (UK) stocks by a technical-signal score with daily weighted randomisation — not a recommendation.
Trend & Price Action
Rightmove’s share price is above both its 20-day simple moving average (SMA), at 526.07 GBp, and its 50-day SMA, at 496.74 GBp. The 20-day average itself rose 4.01% over five days, signalling that the underlying trend has strengthened rather than merely reflecting a one-session spike. There was no new moving-average crossover, so the evidence is an established upward structure, not a newly formed technical signal. The close matched the 20-day resistance level of 563.80 GBp and left the shares close to their three-month high of 565.20 GBp. That is a meaningful test: a sustained move above the recent ceiling would extend the breakout, while a failure to hold near it could expose how much of the recent advance was driven by momentum. The price is also near the top of its Bollinger range, with %B at 96%. Bollinger bands map price against recent volatility; a reading near 100% means the price is close to the upper band, not that a breakout is assured. As shown in the chart, the share price is pressing the upper boundary while the moving averages continue to slope upward.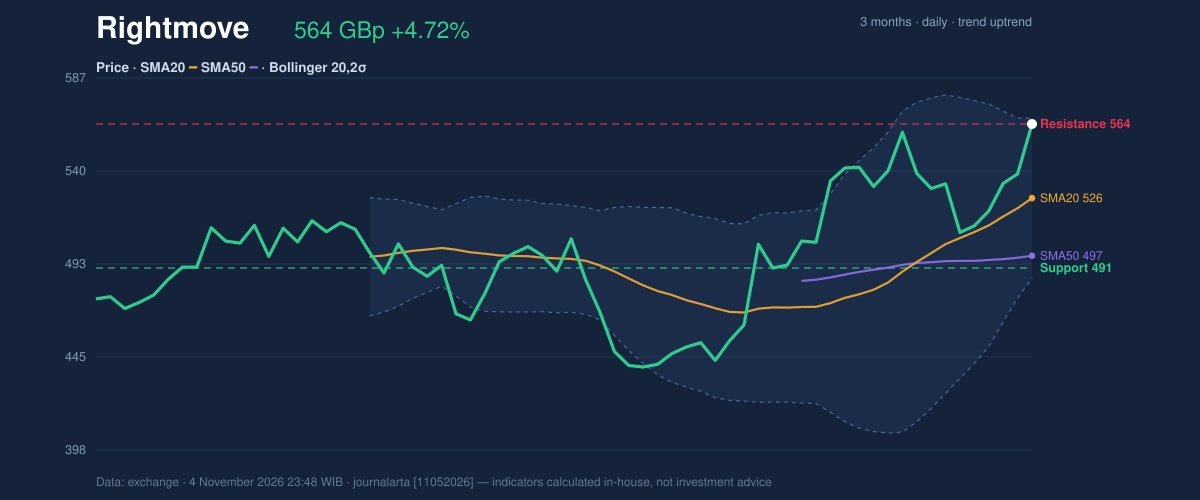
Oscillators & Momentum
The momentum picture is positive but not uniformly comfortable. MACD stands at 14.316 against a signal line of 13.186, leaving a positive histogram of 1.129. The histogram has just turned positive, indicating that short-term momentum has improved relative to its recent baseline. RSI, at 65.9, remains classified as neutral in the supplied data, so it does not yet confirm an extreme condition. Stochastic %K at 97.7 versus %D at 69.1 is overbought, however. This oscillator compares a closing price with its recent range; a high reading can reflect strong buying pressure, but it can also warn that gains have run ahead of the recent pace. Together, the indicators describe an uptrend with improving momentum and a near-term risk of consolidation—not a clear reversal.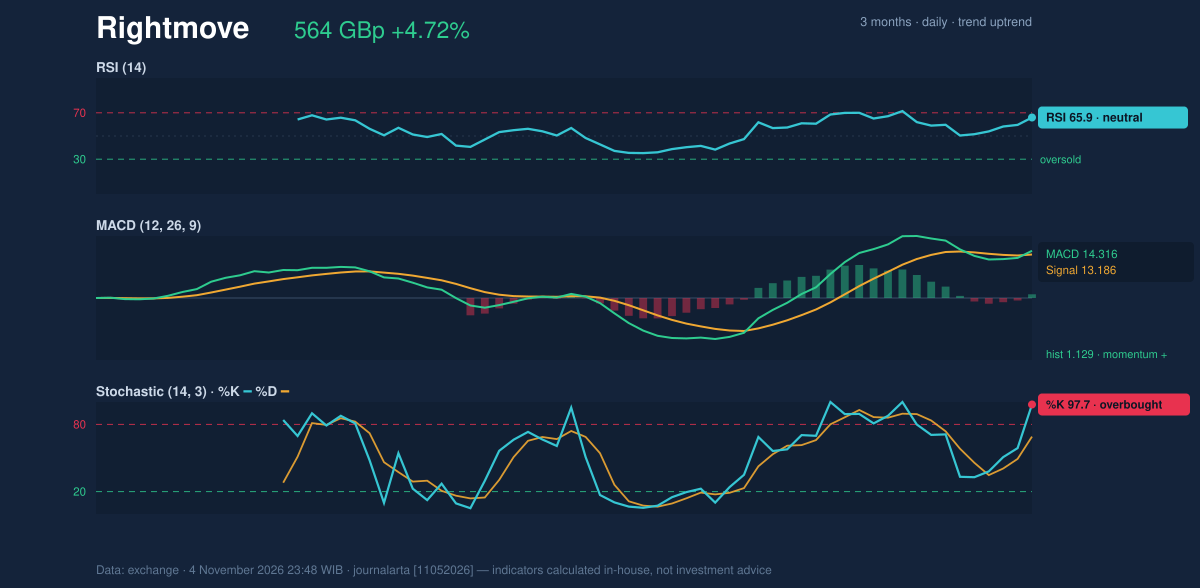
Volatility, Volume & Levels
The upper Bollinger band is 566.78 GBp, just above the close, while the lower band is 485.37 GBp. The 15.5% band width is classified as normal, so the data do not show an unusually tight squeeze or a dramatic volatility expansion. Average True Range (ATR), a measure of typical price movement, is 19.30 GBp, or 3.4% of the share price, indicating moderate volatility. The immediate hurdle is 563.80 GBp resistance, with the three-month high at 565.20 GBp. A move above the latter would place the shares beyond the recent range, but the data provide no higher resistance level. On a pullback, the 20-day average at 526.07 GBp is a nearer trend reference; the defined 20-day support is 490.50 GBp. OBV is rising, but below-average session volume tempers the strength of the breakout signal.Technical Verdict: HOLD (wait & see)
The technical bias is neutral, with two of seven bullish signals and no bearish signals. That balance supports a wait-and-see reading: MACD has turned positive and rising OBV backs the trend, while the shares sit at resistance and Stochastic is overbought. The verdict would be invalidated if the price falls below 490.50 GBp, the 20-day support.- Indicative entry range: 526.07–563.80 GBp, bounded by the 20-day average and current 20-day resistance.
- Reference exit target: 565.20 GBp, the three-month high and next defined resistance beyond the 20-day ceiling.
- Risk-control reference: 490.50 GBp, below which the defined 20-day support would have failed.
Data Table
| Measure | Reading |
|---|---|
| Last price | 563.80 GBp |
| Change | 1 day: 4.72% | 5 days: 10.85% | 1 month: 22.17% |
| SMA20 / SMA50 | 526.07 / 496.74 GBp |
| RSI(14) / Stochastic %K, %D | 65.9 / 97.7, 69.1 |
| MACD / signal / histogram | 14.316 / 13.186 / 1.129 |
| 20-day support / resistance | 490.50 / 563.80 GBp |
| Three-month low / high | 436.10 / 565.20 GBp |
| Session volume / 20-session average | 3,618,363 / 4,188,096 |
Summary Data Rightmove
| Last price | 563.80 GBp |
| Change 1 day / 5 days / 1 month | 4.72% / 10.85% / 22.17% |
| Trend / MA-cross | uptrend / none |
| SMA20 / SMA50 | 526.07 / 496.74 |
| RSI (14) / Stochastic %K | 65.9 / 97.7 |
| Bollinger %B / ATR | 96% / 19.30 |
| Support / Resistance 20 days | 490.50 / 563.80 |
| Data as of | 4 November 2026 23:48 WIB |
Disclaimer: This technical analysis is generated automatically from exchange data and indicators calculated by JournalArta, for information and education only. The verdict and the entry, target and stop-loss levels are not investment advice or a solicitation to buy or sell any security. Investment decisions and their risks rest solely with the reader.
Track Rightmove share price daily: live levels, support/resistance and our full Rightmove analysis history.