GSK Stock Analysis: Gains 3.42%, Golden Cross Formed
On November 4, 2026: price 1,890.00 GBp, trend uptrend, RSI 55.6, support 1,735.50, resistance 1,923.50. technical analysis of gsk stock.
By matthew jonathan
November 5, 20264 min read
GSK Stock Analysis
Why GSK is in focus today
One-day move of 3.42%, about 1.4× its average daily range (ATR)
Fresh golden cross: SMA20 crossed above SMA50
MACD histogram has just turned positive
Uptrend confirmed (5-day change 3.19%)
Selected automatically from 98 LSE (UK) stocks by a technical-signal score with daily weighted randomisation — not a recommendation.
GSK’s shares rose 3.42% to 1,890.00 GBp in Wednesday’s London session, November 4, as trading volume climbed above its recent average and the short-term moving average crossed above the longer one. The move stands out: the day’s gain was about 1.4 times the average daily trading range, while the MACD momentum measure turned positive. Together, those signals point to improving buying pressure, though the price is approaching a nearby resistance level.
Trend & Price Action
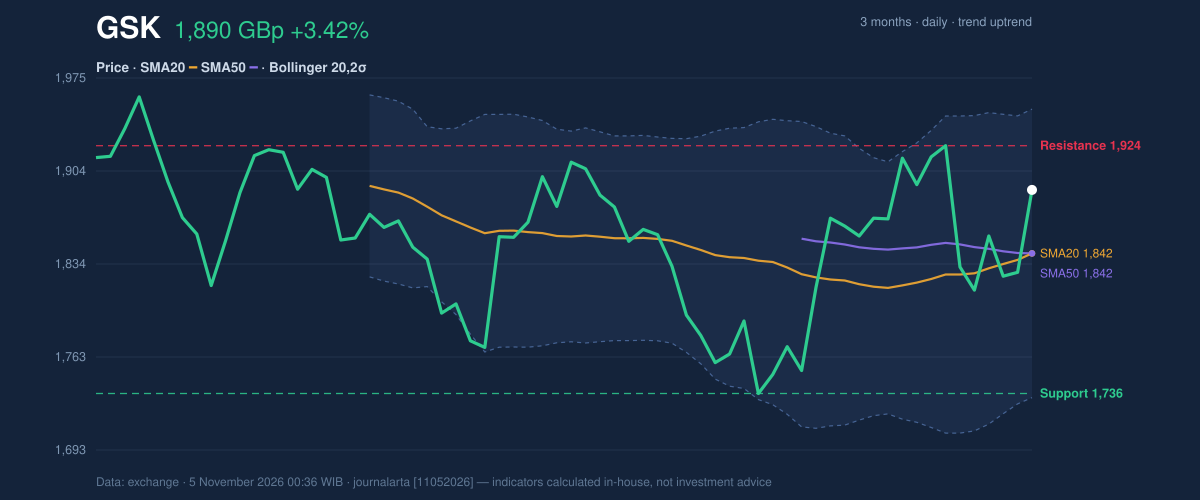
The latest session produced a golden cross: GSK’s 20-day simple moving average moved above its 50-day average. The averages are almost level—1,841.85 and 1,841.83 respectively—so the crossover is narrow, but its timing matters: it formed on the latest session, alongside a rising trend. The 20-day average rose 0.88% over five days, and the share price ended above both averages.
GSK gained 3.19% over five days and 5.56% over one month. That places the session’s jump within a broader advance rather than making it a move unsupported by recent price action. Still, the shares sit at 82% of their 20-day trading range, with resistance at 1,923.50. The three-month high of 2,158.00 is a more distant reference, while the three-month low of 1,735.50 matches the 20-day support level.
The near-term trend has turned more constructive, but GSK is nearing resistance after a sharp one-day rise. The chart shows price above its moving averages, with Bollinger Bands and the marked support and resistance levels.
3-month price action chart of GSK: price, SMA20/50, Bollinger, support & resistance.
Advertisement
Oscillators & Momentum
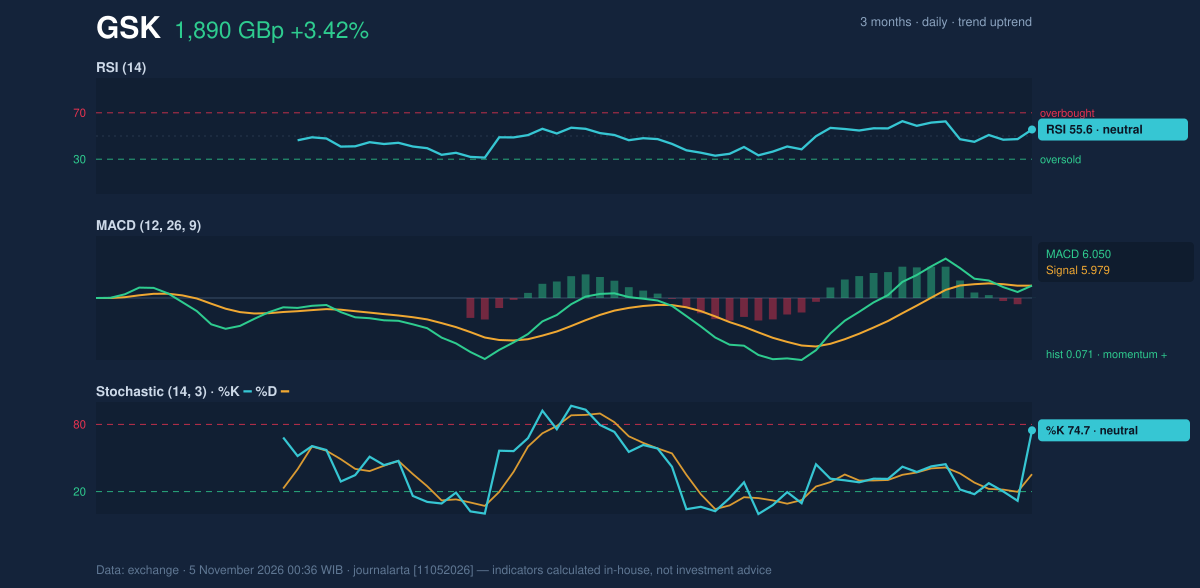
Momentum readings support the upward move, but do not yet indicate that every measure is running hot. The RSI is 55.6, a neutral reading, consistent with positive but not extreme momentum. The Stochastic is also classified as neutral, with %K at 74.7 and %D at 35.6; the gap between the readings shows stronger short-term movement in %K, though the indicator has not confirmed an unambiguous overbought signal in the supplied data.
The MACD histogram has just turned positive at 0.071, with MACD at 6.050 against a signal line of 5.979. This is a small positive margin, but the change adds to the golden cross: two trend-and-momentum signals have improved together rather than the price rise relying on one indicator alone. The chart brings the RSI, MACD and Stochastic readings together.
Momentum chart of GSK: RSI(14), MACD, Stochastic.
Volatility & Volume
The Bollinger position also reflects strength without an extreme reading: GSK’s %B is 72%, meaning the price is in the upper portion of the band range, while the 11.9% band width is described as normal rather than unusually tight or wide. The upper band at 1,951.26 is close enough to matter if the advance continues, but a move toward it is not assured by the indicator.
Average true range, or ATR, is 46.07, equal to 2.4% of the share price—a moderate measure of typical price movement. The 3.42% daily gain exceeded that usual range. Volume was 10,737,094 shares, or 1.3 times the 20-day average, and on-balance volume rose. That combination suggests the move had stronger participation than a quiet price drift, although one session cannot establish that buying pressure will persist.
Advertisement
Key Levels & Scenarios
The immediate test is 20-day resistance at 1,923.50. A sustained break above it would put the three-month high of 2,158.00 in view as the next reference level. If the shares fail to clear resistance, the closely watched short-term average at 1,841.85 may become an initial area to monitor; below that, the supplied support level is 1,735.50. The data also places price minus 1.5 times ATR at 1,820.89, a volatility-based reference between the averages and support.
Technical Verdict: BUY
The supplied technical bias is bullish, with four of seven signals on the bullish side and none on the bearish side. The strongest reasons are the latest-session golden cross, the MACD histogram’s turn positive and rising OBV confirming participation in the uptrend. The main constraint is proximity to resistance after a session gain larger than the average daily range.
- Ideal Entry Range: 1,841.85–1,890.00, anchored to the 20-day average and latest price.
- Exit Target (Target Price): 1,923.50, the next stated resistance.
- Stop Loss protection: 1,820.89, the price-minus-1.5×ATR level; the broader support reference is 1,735.50.
- Invalidation: The bullish verdict is invalidated if price falls below 1,735.50, the 20-day support level.
For non-traders, the indicators currently favor further strength, but resistance and the support level define where that reading would be tested.
Advertisement
Summary Data GSK
Last price
1,890.00 GBp
Change 1 day / 5 days / 1 month
3.42% / 3.19% / 5.56%
Trend / MA-cross
uptrend / golden
SMA20 / SMA50
1,841.85 / 1,841.83
RSI (14) / Stochastic %K
55.6 / 74.7
Bollinger %B / ATR
72% / 46.07
Support / Resistance 20 days
1,735.50 / 1,923.50
Data as of
5 November 2026 00:36 WIB
Disclaimer: This technical analysis is generated automatically from exchange data and indicators calculated by JournalArta, for information and education only. The verdict and the entry, target and stop-loss levels are not investment advice or a solicitation to buy or sell any security. Investment decisions and their risks rest solely with the reader.