On November 4, 2026: price 9,790.00 GBp, trend uptrend, RSI 71.2, support 8,350.00, resistance 9,790.00. technical analysis of lseg stock.
By matthew jonathan
November 5, 20264 min read
Logo London Stock Exchange Group — JournalArta illustration
Why LSEG is in focus today
One-day move of 3.55%, about 1.2× its average daily range (ATR)
Closed at a 20-day high (9,790.00)
Trading near its 3-month high (9,790.00)
RSI(14) at 71.2 — overbought zone
Uptrend confirmed (5-day change 6.58%)
Selected automatically from 98 LSE (UK) stocks by a technical-signal score with daily weighted randomisation — not a recommendation.
LSEG’s shares rose 3.55% to 9,790.00 GBp on Wednesday, November 4, 2026, closing at their highest level in the past 20 trading days and matching their three-month peak. The 6.58% gain over five days confirms a strong upward run, but the price is now pressing against resistance as momentum indicators signal overbought conditions. That combination makes the rally worth watching: buyers have pushed the shares to a key ceiling, while the pace of gains raises the risk of a pause.
Trend & Price Action
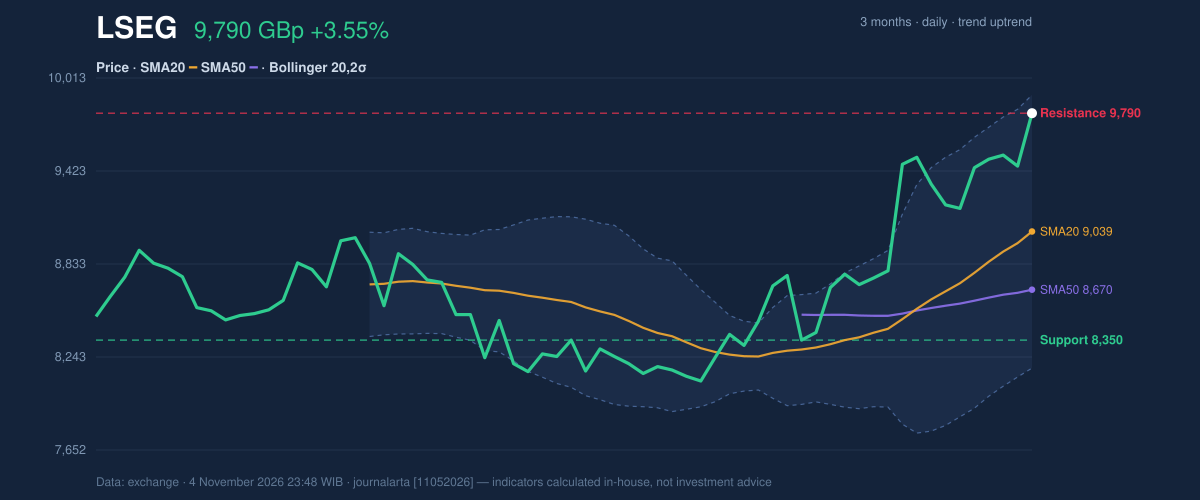
The share price is above both its 20-day moving average of 9,039.00 and 50-day average of 8,669.96. The 20-day average rose 3.76% over five days, indicating that the short-term trend is strengthening rather than merely reflecting a single session’s jump. No new moving-average crossover has formed, so the latest advance is not marked by a fresh technical shift between the two trend lines.
LSEG has climbed 17.72% in a month and ended at the top of its 20-day range. The close is also the three-month high, 9,790.00, making that level both a record for the periods measured and a test of whether the rally can extend. The shares remain close to the upper Bollinger band at 9,906.11; with %B at 93%, price is near the top of its recent statistical range, not breaking out beyond it.
The trend is upward, but the close at 9,790.00 leaves little room before the nearest measured resistance. The 20-day support is 8,350.00, while the three-month low is 8,012.00. These levels frame a wide gap between the current peak and the lower boundary; a retreat from resistance would not by itself erase the broader uptrend, though a fall through support would materially weaken the price structure.
3-month price action chart of LSEG: price, SMA20/50, Bollinger, support & resistance.
Advertisement
Oscillators & Momentum
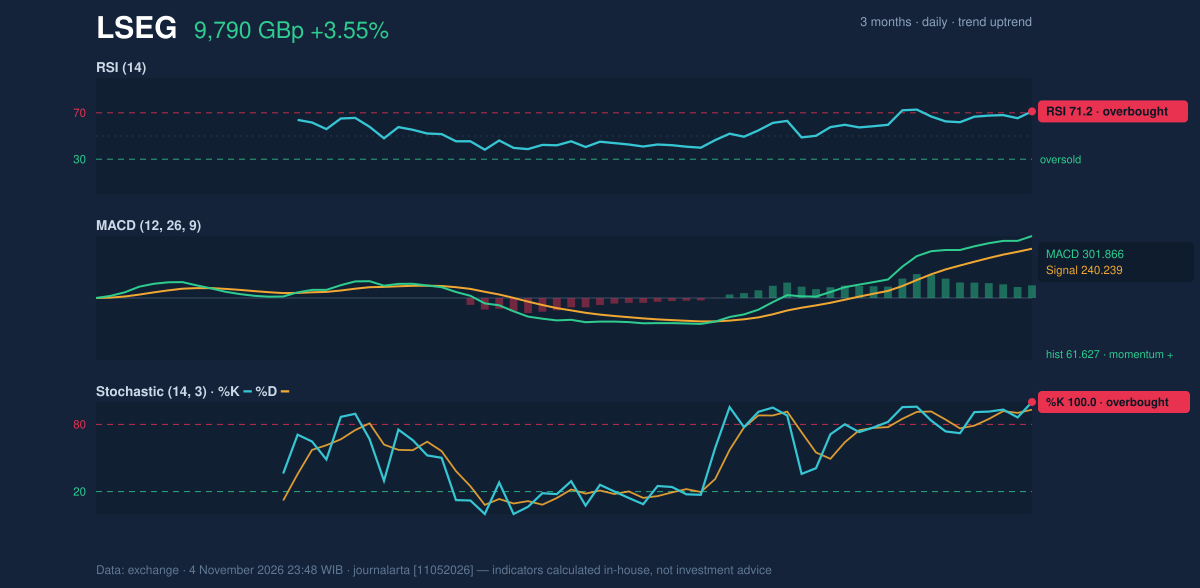
The momentum readings show why the price advance needs confirmation. RSI at 71.2 is in overbought territory, while Stochastic %K at 100.0 and %D at 93.2 are also overbought. These readings describe unusually strong recent buying, but they are not automatic reversal signals: in a rising market, indicators can remain elevated. Their significance is that the shares may be more vulnerable to a pause or pullback if fresh demand does not arrive.
MACD remains positive: 301.866 is above its 240.239 signal line, and the histogram is positive at 61.627. That supports the direction of the trend, even as the overbought oscillators warn that momentum has become stretched. In other words, the indicators agree that the advance is real, but differ on how much near-term room remains.
Momentum chart of LSEG: RSI(14), MACD, Stochastic.
Volatility, Volume & Levels
The Bollinger-band width of 19.2% is classified as normal, not a squeeze that would point to unusually compressed trading conditions. ATR stands at 284.14, or 2.9% of the share price, indicating moderate volatility. The one-day rise of 3.55% was around 1.2 times the average daily range, a sizeable move, but not one that alone establishes a new volatility regime.
Trading volume was 1,126,007 shares, below the 20-day average of 1,413,474, at 0.8 times normal. That tempers the force of the breakout attempt: the price reached a new 20-day high without above-average turnover. OBV, however, is rising, suggesting that buying pressure has accumulated over time rather than depending solely on the latest session.
The technical-bias model is neutral, with one of seven bullish signals—rising OBV—and no bearish signals. That is consistent with a rising price trend offset by overbought momentum and subdued volume: the evidence does not point to a confirmed reversal, but it also falls short of broad technical confirmation.
Advertisement
Technical Verdict: HOLD
HOLD (wait & see) matches the neutral technical bias. The strongest supporting factors are the overbought RSI and Stochastic readings, which raise pullback risk; volume below its 20-day average, which limits confirmation of the move; and the price sitting at 20-day resistance and the three-month high. Against those concerns, MACD is positive and OBV is rising.
The verdict is invalidated if the price falls below the 20-day support at 8,350.00 GBp.
Ideal entry range: 9,039.00–9,790.00 GBp, between the 20-day average and current resistance.
Exit target: 9,906.11 GBp, the upper Bollinger band, as a reference level beyond resistance.
Stop-loss protection: 8,350.00 GBp, the 20-day support.
For non-traders, the chart points to a strong climb that has reached a ceiling, so the signals remain mixed rather than decisive.
Summary Data LSEG
Last price
9,790.00 GBp
Change 1 day / 5 days / 1 month
3.55% / 6.58% / 17.72%
Trend / MA-cross
uptrend / none
SMA20 / SMA50
9,039.00 / 8,669.96
RSI (14) / Stochastic %K
71.2 / 100.0
Bollinger %B / ATR
93% / 284.14
Support / Resistance 20 days
8,350.00 / 9,790.00
Data as of
4 November 2026 23:48 WIB
Advertisement
Disclaimer: This technical analysis is generated automatically from exchange data and indicators calculated by JournalArta, for information and education only. The verdict and the entry, target and stop-loss levels are not investment advice or a solicitation to buy or sell any security. Investment decisions and their risks rest solely with the reader.