Vodafone Stock Gains 3.37%, Momentum Gains In Focus
On November 4, 2026: price 121.15 GBp, trend sideways, RSI 52.3, support 116.70, resistance 124.40. technical analysis of vodafone stock.
Why Vodafone is in focus today
- One-day move of 3.37%, about 1.7× its average daily range (ATR)
- Volume at 3.9× the 20-day average
- MACD histogram has just turned positive
- Not covered by JournalArta in the last 14 days
Selected automatically from 98 LSE (UK) stocks by a technical-signal score with daily weighted randomisation — not a recommendation.
Trend & Price Action
At 121.15 GBp, the share price is above its 20-day simple moving average (SMA) of 118.97 GBp, but below its 50-day average of 122.79 GBp. The shorter average is sloping down: the 20-day average fell 1.65% over five days. This matters because a price rebound above the short-term average can reflect near-term demand without overturning the broader weakness signalled by trading below the longer average. There is no new moving-average crossover. Vodafone sits at 58% of its 20-day range, between support at 116.70 GBp and resistance at 124.40 GBp. The three-month range extends from 113.79 GBp to 132.07 GBp, so the share remains well below its recent high even after the latest session’s advance.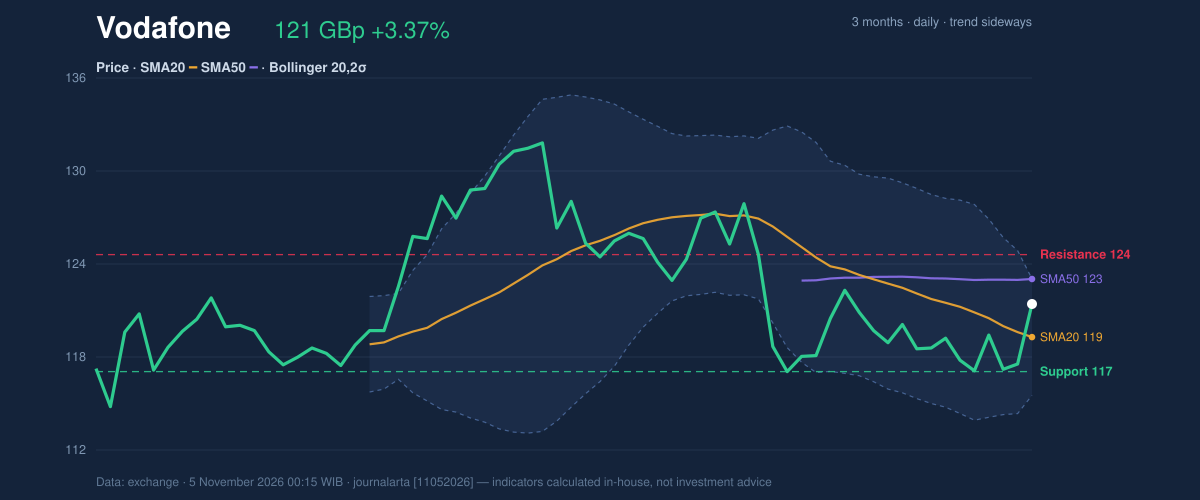
Oscillators & Momentum
The momentum signals are mixed. RSI is neutral at 52.3, indicating neither strongly stretched buying nor selling pressure. By contrast, Stochastic %K at 83.8 is overbought relative to %D at 37.5, a warning that the quick advance may be running ahead of the steadier trend. MACD offers a more constructive sign. Its histogram is positive at 0.175, with MACD at -1.254 above its signal line at -1.429. The histogram has just turned positive, pointing to improving short-term momentum. But both MACD and its signal remain below zero, so the shift shows that downward momentum has eased rather than confirming a sustained bullish trend.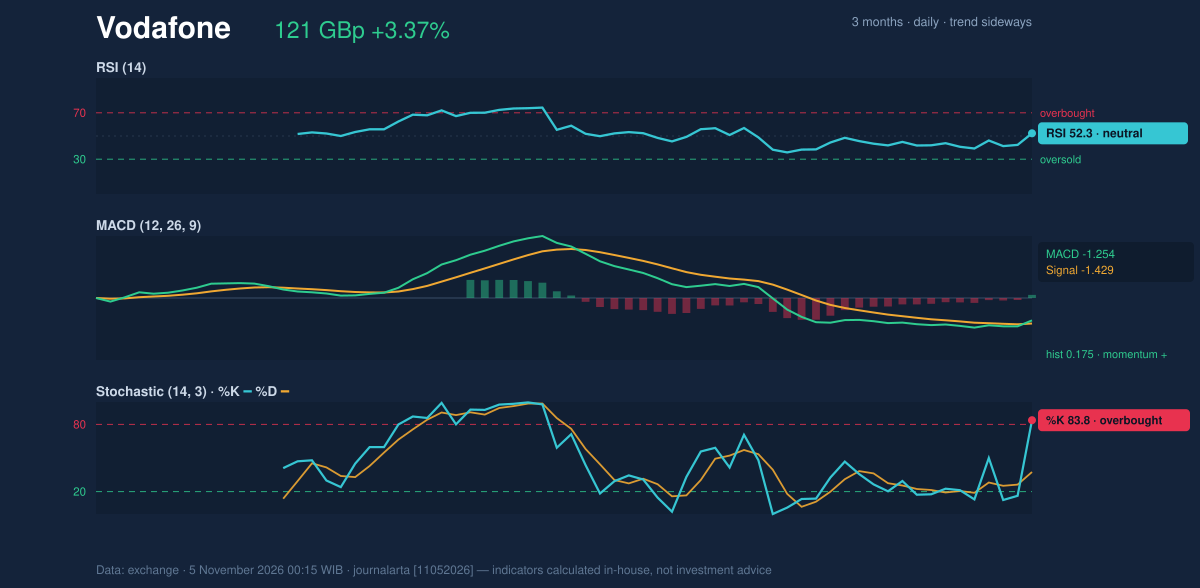
Volatility, Volume & Key Levels
The session’s volume of 238,546,766 shares, compared with a 20-day average of 60,669,746, and rising OBV (on-balance volume, a measure that relates volume to price direction) support the view that the rebound drew substantial participation. That is stronger confirmation than a price rise on quiet trading, although one unusually active session cannot establish that demand will persist. ATR is 2.36 GBp, or 1.9% of the share price, indicating moderate volatility. If Vodafone clears 124.40 GBp, the next notable reference is the three-month high at 132.07 GBp. A failure to hold the 20-day average at 118.97 GBp would weaken the rebound; a break below 116.70 GBp would put the three-month low at 113.79 GBp back in view. These are conditional levels, not predictions.Technical Verdict: HOLD (wait & see)
The neutral verdict reflects three competing signals: the price is above the 20-day average but below the 50-day average; the MACD histogram has turned positive, while Stochastic is overbought; and the narrow Bollinger Bands suggest a possible breakout without indicating its direction. The technical-bias reading is therefore neutral, rather than a confirmed directional signal. - Ideal entry range: 118.97–121.15 GBp, from the 20-day average to the latest price. - Exit target: 124.40 GBp, the 20-day resistance. - Stop-loss protection: 116.70 GBp, the 20-day support. - Invalidation: The neutral setup is invalidated on a break below 116.70 GBp. In plain English, the latest rebound has credible volume behind it, but Vodafone has not yet cleared the longer-term resistance implied by its 50-day average.| Metric | Reading |
|---|---|
| Latest price | 121.15 GBp |
| Daily change | +3.37% |
| Technical bias | Neutral |
| 20-day support / resistance | 116.70 / 124.40 GBp |
| Session | Wednesday, November 4, 2026 |
Summary Data Vodafone
| Last price | 121.15 GBp |
| Change 1 day / 5 days / 1 month | 3.37% / 3.15% / -5.17% |
| Trend / MA-cross | sideways / none |
| SMA20 / SMA50 | 118.97 / 122.79 |
| RSI (14) / Stochastic %K | 52.3 / 83.8 |
| Bollinger %B / ATR | 78% / 2.36 |
| Support / Resistance 20 days | 116.70 / 124.40 |
| Data as of | 5 November 2026 00:15 WIB |
Disclaimer: This technical analysis is generated automatically from exchange data and indicators calculated by JournalArta, for information and education only. The verdict and the entry, target and stop-loss levels are not investment advice or a solicitation to buy or sell any security. Investment decisions and their risks rest solely with the reader.
Track Vodafone share price daily: live levels, support/resistance and our full Vodafone analysis history.