RSI Overbought, MCD Stock Gains 6.53% on Wednesday
On November 4, 2026: price 280.22 USD, trend uptrend, RSI 79.2, support 235.23, resistance 280.22. technical analysis of mcd stock. RSI Overbought — full…

Why MCD is in focus today
- One-day move of 6.53%, about 3.1× its average daily range (ATR)
- Volume at 2.0× the 20-day average
- Trading near its 3-month high (281.14)
- Fresh golden cross: SMA20 crossed above SMA50
- RSI(14) at 79.2 — overbought zone
- Uptrend confirmed (5-day change 11.86%)
Selected automatically from 80 NYSE (US) stocks by a technical-signal score with daily weighted randomisation — not a recommendation.
Trend & Price Action
The shares gained 11.86% over five days and 21.37% over one month. The 20-day moving average rose 3.41% over five days, and the latest close sits above both the 20-day average of 248.96 and the 50-day average of 248.22. On the latest session, the 20-day average crossed above the 50-day average, a golden cross that signals improving trend structure rather than guaranteeing further gains. The move was unusually large relative to recent volatility: the one-day advance was about 3.1 times the 14-day average true range, or ATR, of 5.95. ATR estimates a stock’s typical daily movement; at 2.1% of the share price, it indicates moderate volatility by this measure, but the latest jump was far from ordinary. The close also reached the 20-day resistance of 280.22 and stood close to the three-month high of 281.14. The breakout has participation behind it. Volume reached 11,520,800 shares, or 2.0 times the 20-day average, while on-balance volume (OBV)—a measure that tracks whether trading volume is flowing more often with rising or falling prices—also rose. That combination supports the advance, although a price at the top of its recent range leaves little room before the next visible barrier.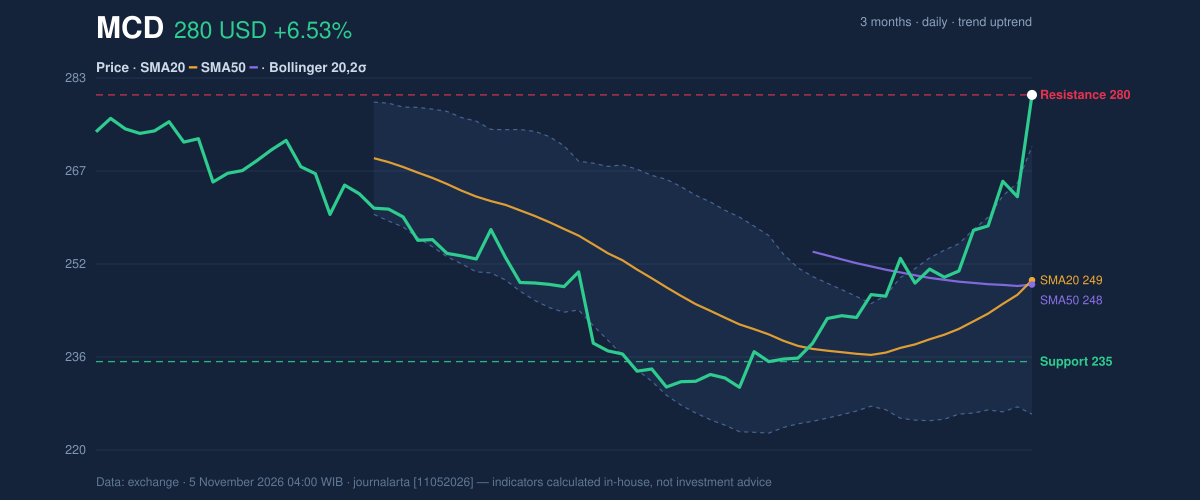
Oscillators & Momentum
Momentum indicators confirm the strength of the move but warn that it has become stretched. The RSI is 79.2, in overbought territory; RSI compares the size of recent gains with recent losses, and readings above 70 are commonly treated as a sign that upward momentum may be overextended. The Stochastic reading is also overbought, with %K at 97.8 and %D at 95.8, suggesting the latest close is near the top of its recent trading range. That does not, by itself, establish a reversal. The MACD remains positive at 6.229, above its 2.649 signal line, with a positive histogram of 3.581. MACD compares short- and longer-term price trends; its positive configuration indicates upward momentum remains intact. The tension is between that trend confirmation and the overbought readings, which raise the possibility of consolidation or a pullback before another attempt higher.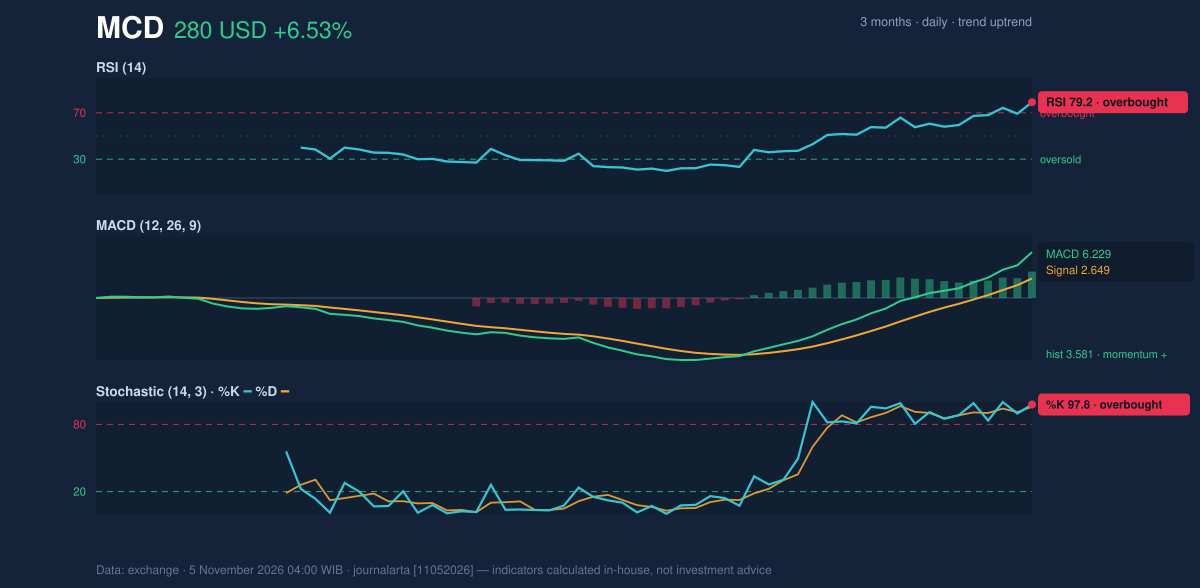
Volatility & Key Levels
The close above the upper Bollinger Band of 271.57 places the price at 119% of the band range, while the band width of 18.2% is described as normal rather than unusually compressed. Bollinger Bands measure price relative to a moving average and its recent volatility. Trading above the upper band shows the rally has stretched beyond its typical range; it is a sign of strength, but also makes a near-term cooling-off move plausible. The immediate test is the three-month high at 281.14. A sustained move above that level would put the next reference at 289.14, calculated in the supplied data as the price plus 1.5 times ATR. If the shares fail to hold above the breakout area, 271.30—the price minus 1.5 times ATR—is a nearer volatility-based reference. The 20-day support at 235.23 is substantially lower and marks a deeper structural level, not a close-in gauge of routine price fluctuation.Fundamental Context
The technical surge comes alongside recent regulatory filings. According to its SEC filing, McDonald’s reported quarterly revenue of $7.10 billion for the quarter ended June 30, 2026, up 3.7% from $6.84 billion a year earlier. Net income was $2.36 billion, compared with $2.25 billion a year earlier, and diluted earnings per share were $3.32. The company filed a Form 8-K with the SEC on November 4 reporting results of operations and financial condition; those disclosures provide business context, while the verdict below is driven by the supplied price and volume signals.Technical Verdict: BUY
The supplied technical bias is bullish, with three of seven signals positive and none negative. The strongest supports are the latest-session golden cross, the close above the 20-day high on volume at least 1.5 times its average, and rising OBV. Overbought RSI and Stochastic readings are meaningful near-term risks, but they do not overturn the stated bias. The verdict is invalidated if price falls below the 20-day support of 235.23. - Entry range: 271.30–280.22, using the ATR-based reference and 20-day resistance. - Exit target: 281.14, the three-month high; if price moves above that level, the next supplied reference is 289.14. - Stop-loss protection: 235.23, below 20-day support. In plain English, the trend signals point upward, but the unusually strong run has left the shares vulnerable to a pause.Summary Data MCD
| Last price | 280.22 USD |
| Change 1 day / 5 days / 1 month | 6.53% / 11.86% / 21.37% |
| Trend / MA-cross | uptrend / golden |
| SMA20 / SMA50 | 248.96 / 248.22 |
| RSI (14) / Stochastic %K | 79.2 / 97.8 |
| Bollinger %B / ATR | 119% / 5.95 |
| Support / Resistance 20 days | 235.23 / 280.22 |
| Data as of | 5 November 2026 04:00 WIB |
Disclaimer: This technical analysis is generated automatically from exchange data and indicators calculated by JournalArta, for information and education only. The verdict and the entry, target and stop-loss levels are not investment advice or a solicitation to buy or sell any security. Investment decisions and their risks rest solely with the reader.
Track MCD stock price daily: live levels, support/resistance and our full MCD analysis history.