Golden Cross Formed, PEP Stock Gains 3.75% on Wednesday
On November 4, 2026: price 142.42 USD, trend uptrend, RSI 65.5, support 125.97, resistance 142.42. technical analysis of pep stock. Golden Cross Formed — full…

Why PEP is in focus today
- One-day move of 3.75%, about 1.6× its average daily range (ATR)
- Closed at a 20-day high (142.42)
- Fresh golden cross: SMA20 crossed above SMA50
- Uptrend confirmed (5-day change 7.38%)
Selected automatically from 100 NASDAQ (US) stocks by a technical-signal score with daily weighted randomisation — not a recommendation.
Trend & Price Action
PepsiCo finished above both its 20-day simple moving average (SMA), at $133.36, and its 50-day average, at $133.29. The 20-day average has risen 2.48% over five days, while a golden cross formed on the latest session: the shorter-term average moved above the longer-term one. That crossover supports the view that the trend has improved, though it is a lagging signal rather than a guarantee of further gains. The stock is also at its $142.42 20-day resistance and sits near the three-month high of $145.90. Resistance is a price area where selling has previously checked gains; moving above it would suggest buyers are willing to pay more, while a failure to hold near the range ceiling could invite profit-taking.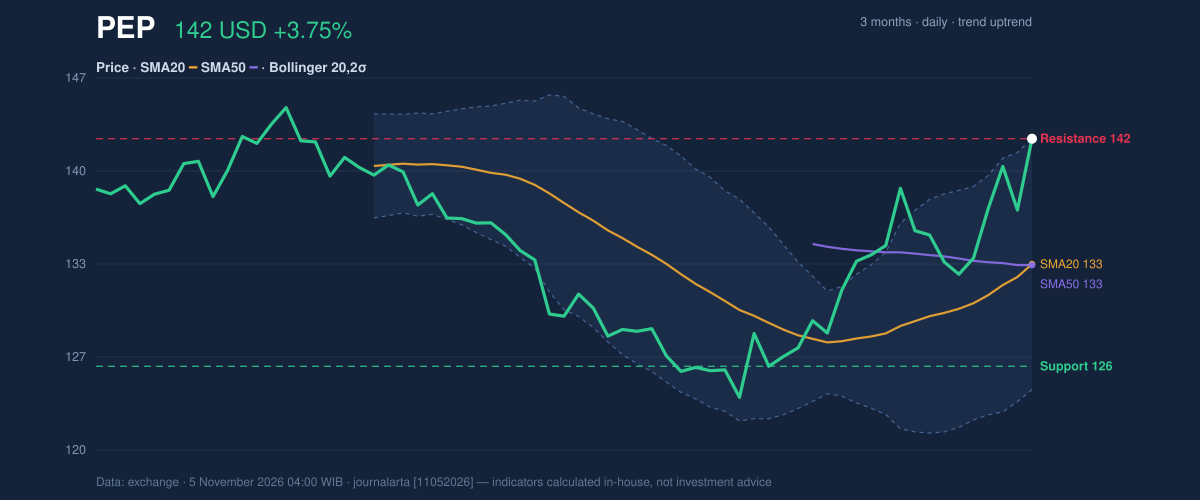
Oscillators & Momentum
Momentum measures are positive, but they are not all giving the same degree of confirmation. The RSI, which tracks the pace of recent gains and losses, is 65.5, in neutral territory. That suggests strength without yet reaching the conventional overbought zone. The MACD is above its signal line, with a positive histogram, indicating that upward momentum remains in place. The Stochastic readings, however, are overbought at 89.8 for %K and 87.6 for %D. This does not by itself signal a reversal; it does mean the recent rise has been rapid enough that the shares may be vulnerable to a pause or pullback. The contrast—positive MACD and neutral RSI against an overbought Stochastic—argues for a more measured reading than the price jump alone might imply.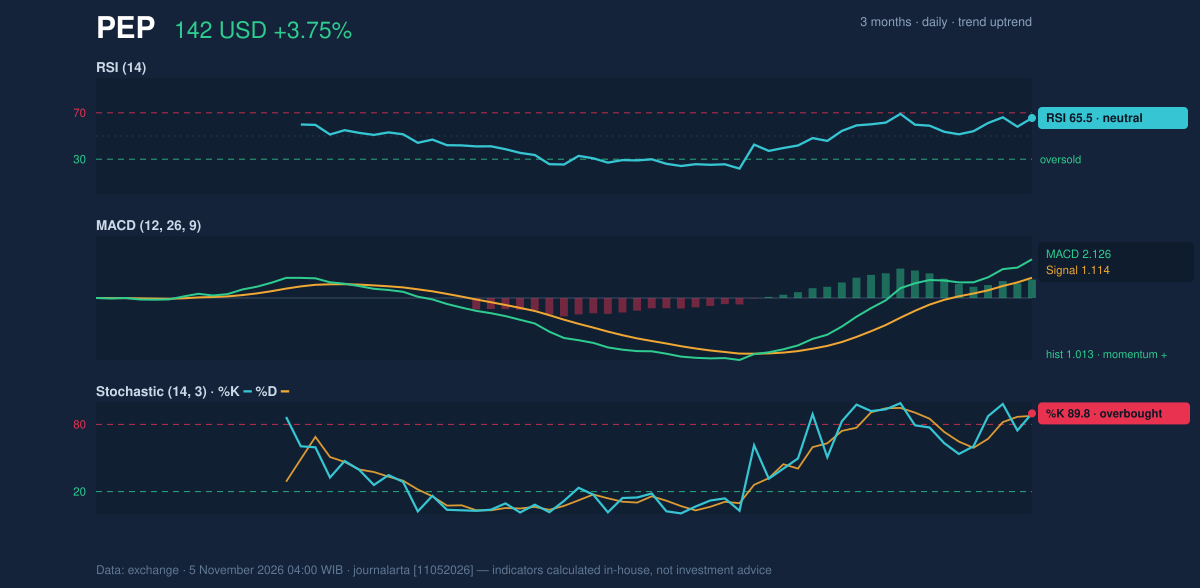
Volatility & Volume
PepsiCo’s close was just below the upper Bollinger Band at $142.44, with the band’s middle line at $133.36 and lower line at $124.28. The stock’s position at 100% of the band range shows it is pressing the upper boundary. The band width is 13.6%, described as normal, so the data do not indicate an unusually tight volatility squeeze that might foreshadow an abrupt expansion. Trading volume was 12,078,200 shares, or 1.2 times the 20-day average. On-balance volume (OBV), which uses volume to track whether trading is accumulating alongside price moves, is rising. That adds participation behind the advance, though it does not remove the risk implied by stretched short-term momentum.Key Levels & Scenarios
The immediate test is whether the stock can establish itself above $142.42 and approach the $145.90 three-month high. A sustained move through the former would put the broader high in focus; a rejection at resistance could bring the rising averages back into view. The 20-day support is $125.97, with the three-month low at $123.47. ATR is $3.35, or 2.3% of price, consistent with moderate volatility; the reference level 1.5 ATR below the last price is $137.40. PepsiCo’s operating results provide context, not a substitute for the technical picture. According to its SEC filing, quarterly revenue for the period ended September 5, 2026, was $25.27 billion, up 5.6% from $23.94 billion a year earlier. Net income was $3.05 billion, compared with $2.60 billion, and diluted earnings per share were $2.23.Technical Verdict: HOLD (wait & see)
The required technical bias is neutral, despite the absence of bearish signals. A fresh golden cross and rising OBV are constructive, but the Stochastic is overbought and the price is pressing 20-day resistance after a steep short-term advance. That combination supports a wait-and-see reading rather than a directional call. - Ideal entry range: $137.40–$142.42, bounded by the price-minus-1.5-ATR reference and 20-day resistance. - Exit target: $145.90, the three-month high. - Stop-loss protection: $125.97, below 20-day support. - Invalidation: The neutral verdict is invalidated if price falls below $125.97. For non-traders, the chart signals are improving, but the shares are already testing resistance while short-term momentum is stretched.Summary Data PEP
| Last price | 142.42 USD |
| Change 1 day / 5 days / 1 month | 3.75% / 7.38% / 15.11% |
| Trend / MA-cross | uptrend / golden |
| SMA20 / SMA50 | 133.36 / 133.29 |
| RSI (14) / Stochastic %K | 65.5 / 89.8 |
| Bollinger %B / ATR | 100% / 3.35 |
| Support / Resistance 20 days | 125.97 / 142.42 |
| Data as of | 5 November 2026 04:00 WIB |
Disclaimer: This technical analysis is generated automatically from exchange data and indicators calculated by JournalArta, for information and education only. The verdict and the entry, target and stop-loss levels are not investment advice or a solicitation to buy or sell any security. Investment decisions and their risks rest solely with the reader.
Track PEP stock price daily: live levels, support/resistance and our full PEP analysis history.