ABNB Stock Technicals: Gains 5.64% on Wednesday, Golden Cross Formed
On November 4, 2026: price 176.37 USD, trend uptrend, RSI 59.2, support 163.23, resistance 176.94. technical analysis of abnb stock. ABNB Stock Technicals —…
Why ABNB is in focus today
- One-day move of 5.64%, about 2.0× its average daily range (ATR)
- Volume at 1.6× the 20-day average
- Fresh golden cross: SMA20 crossed above SMA50
- MACD histogram has just turned positive
- Uptrend confirmed (5-day change 6.22%)
Selected automatically from 100 NASDAQ (US) stocks by a technical-signal score with daily weighted randomisation — not a recommendation.
Trend & Price Action
The latest gain followed rises of 6.22% over five days and 9.80% over one month. Airbnb’s price is above its 20-day moving average of $169.91 and its 50-day average of $169.32; the 20-day average rose 1.11% over five days, indicating that the short-term trend is strengthening rather than merely catching up after a flat stretch. On the latest session, the 20-day average crossed above the 50-day average, a pattern known as a golden cross and often read as evidence of improving momentum. There is a near-term constraint: at $176.37, the stock is already at 96% of its 20-day range, with resistance at $176.94. The three-month high of $193.45 is farther above, while the 20-day support at $163.23 marks an important lower boundary if the advance reverses.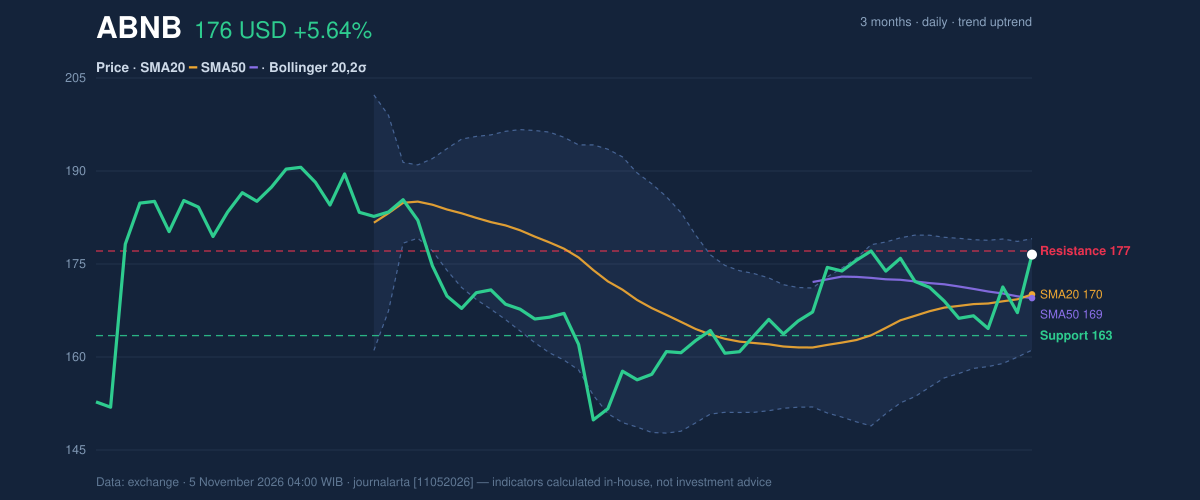
Oscillators & Momentum
Momentum indicators lean positive without showing a uniformly overheated market. RSI, which gauges the pace of recent gains and losses, is neutral at 59.2. The Stochastic readings are also neutral: %K is 76.9 and %D is 47.8. Their gap suggests the faster measure has moved ahead, but the readings do not by themselves establish that a reversal is underway. The MACD, a trend-momentum indicator, is positive at 0.917 versus a 0.799 signal line, with its histogram at 0.118. The histogram’s move into positive territory adds confirmation to the golden cross: short-term momentum has turned upward alongside the moving-average structure, rather than the price rising in isolation.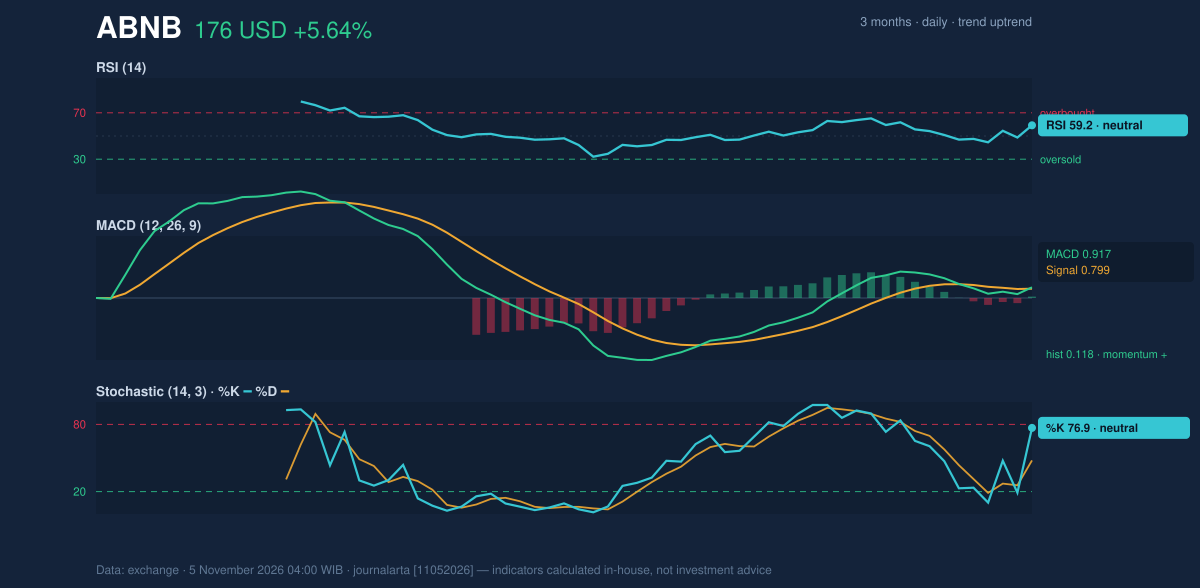
Levels & Scenarios
Airbnb is testing resistance at $176.94, just below the upper Bollinger band at $178.94. A sustained move through that zone would put the three-month high of $193.45 in focus as the next major reference level. Failure to hold the advance would bring the 20-day average at $169.91 into view, followed by support at $163.23. ATR is $4.92, or 2.8% of the share price, consistent with moderate volatility rather than a quiet trading environment.Fundamental Context
Airbnb reported quarterly revenue of $3.61 billion for the quarter ended June 30, 2026, up 16.5% from $3.10 billion a year earlier, according to its SEC filing. Net income was $816.0 million, compared with $642.0 million a year earlier, according to the same filing. Those results provide business context for the shares, but the assessment below is driven by the technical signals.Technical Verdict: BUY
The technical bias is bullish, with three of seven signals bullish and none bearish. The strongest evidence is the latest-session golden cross, the MACD histogram turning positive, and the rising-price trend above the 50-day average. The main caution is the stock’s proximity to resistance, alongside falling OBV despite elevated volume. The technical setup is bullish, but the price is testing resistance and the volume trend calls for caution. - Ideal entry range: $169.91–$176.94, between the 20-day average and 20-day resistance. - Exit target: $193.45, the three-month high and next reference level beyond resistance. - Stop-loss protection: Below $163.23, the 20-day support. - Invalidation condition: The bullish verdict is invalidated if the price falls below $163.23. In plain English, the chart favors a rising trend, but its strength depends on holding support and overcoming nearby resistance. | Indicator | Reading | |---|---:| | Last price | $176.37 | | 20-day / 50-day average | $169.91 / $169.32 | | RSI / Stochastic | 59.2 / 76.9 and 47.8 | | MACD / signal / histogram | 0.917 / 0.799 / 0.118 | | Support / resistance | $163.23 / $176.94 |Summary Data ABNB
| Last price | 176.37 USD |
| Change 1 day / 5 days / 1 month | 5.64% / 6.22% / 9.80% |
| Trend / MA-cross | uptrend / golden |
| SMA20 / SMA50 | 169.91 / 169.32 |
| RSI (14) / Stochastic %K | 59.2 / 76.9 |
| Bollinger %B / ATR | 86% / 4.92 |
| Support / Resistance 20 days | 163.23 / 176.94 |
| Data as of | 5 November 2026 04:00 WIB |
Disclaimer: This technical analysis is generated automatically from exchange data and indicators calculated by JournalArta, for information and education only. The verdict and the entry, target and stop-loss levels are not investment advice or a solicitation to buy or sell any security. Investment decisions and their risks rest solely with the reader.
Track ABNB stock price daily: live levels, support/resistance and our full ABNB analysis history.