BKNG Stock Gains 9.83%, Testing Key Resistance In Focus
On November 4, 2026: price 170.97 USD, trend sideways, RSI 61.0, support 147.94, resistance 170.97. technical analysis of bkng stock. BKNG Stock Gains — full…

Why BKNG is in focus today
- One-day move of 9.83%, about 2.7× its average daily range (ATR)
- Volume at 1.9× the 20-day average
Selected automatically from 100 NASDAQ (US) stocks by a technical-signal score with daily weighted randomisation — not a recommendation.
Trend & Price Action
BKNG’s close stood above its 20-day moving average of $157.91 and its 50-day average of $168.14, a constructive position after the sharp advance. Yet the broader trend is classified as sideways, and the 20-day average fell 0.38% over five days. That decline shows the longer-running price structure has not yet turned decisively upward. No new moving-average crossover was recorded. The session’s close matched the 20-day resistance of $170.97, placing the shares at the top of their recent range. The price also finished above the Bollinger upper band of $169.83, with %B at 105%. This means the close exceeded the band’s usual envelope; it can signal unusually strong demand, but is not by itself proof that gains will continue. The three-month high of $217.32 remains well above the current price. As shown in the chart, the sharp move has taken BKNG from the middle of its recent price structure to a key test at resistance.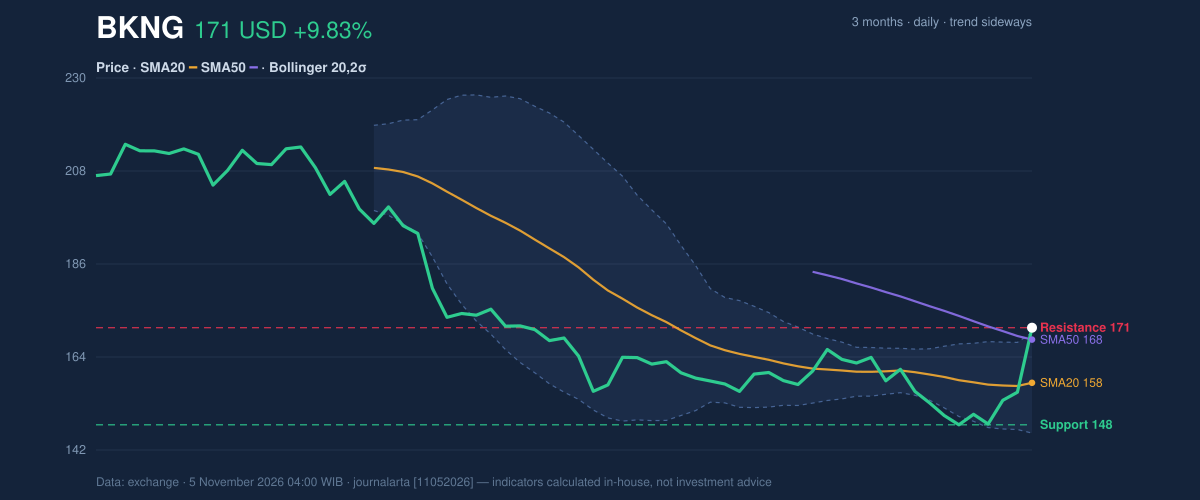
Oscillators & Momentum
Momentum signals have improved, though they are not uniformly supportive. The MACD histogram turned positive at 1.639, with MACD at -2.992 and its signal line at -4.632. The histogram’s move above zero indicates improving short-term momentum, even as the MACD itself remains below zero. RSI at 61.0 is neutral, rather than showing an extreme reading. The stochastic oscillator is more stretched: %K at 88.8 is above the overbought threshold, while %D is 54.9. That gap is consistent with a rapid advance and raises the chance of a pause or pullback. The technical-bias calculation also flags an RSI rebound from below 35 and a close above the 20-day high on volume at least 1.5 times average. Those signals support the move, but do not erase the risk of short-term overheating. The chart places these momentum readings alongside the price jump: the positive MACD histogram and neutral RSI confirm improvement, while the elevated stochastic signals strain.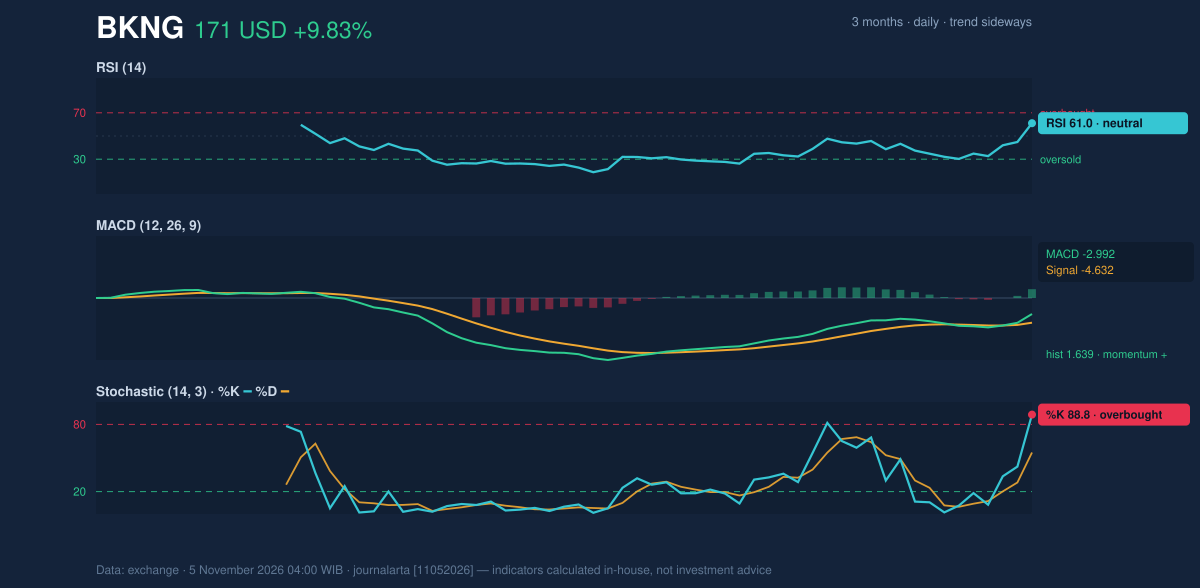
Volatility, Volume & Key Levels
Trading volume of 14,634,100 shares was 1.9 times the 20-day average of 7,546,295. On-balance volume, which tracks whether volume is flowing more heavily on rising or falling sessions, also increased. That participation gives the rally more weight than a price move on thin trading would have. Volatility is elevated. Average True Range, a measure of typical price movement, was $6.31, or 3.7% of the share price. The session’s advance was therefore unusually large relative to recent movement. The Bollinger-band width, by contrast, remained normal at 15.1%, so the signal is a strong single-session break rather than an established expansion in the band range. The immediate test is whether BKNG can hold above $170.97, its 20-day resistance and the session’s close. A sustained break would put the three-month high of $217.32 in view as the next major reference level, not a forecast. If the shares retreat, $161.51—the price minus 1.5 times ATR—offers a volatility-based reference, while the 20-day support at $147.94 marks a deeper level where the setup would face a more serious test. The three-month low is $146.28.Fundamental Context
According to its SEC filing, Booking Holdings reported quarterly revenue of $8.89 billion for the quarter ended September 30, 2026, down 1.3% from $9.01 billion a year earlier. Net income was $2.72 billion, compared with $2.75 billion, and diluted earnings per share were $3.61. The slight year-on-year declines in revenue and earnings provide a more measured business backdrop to a sharp share-price rally. The company filed its results with the SEC on November 3.Technical Verdict: BUY
The technical bias is bullish, with three of seven bullish signals and no bearish signals in the supplied assessment. The supporting evidence is the positive MACD histogram, the high-volume close above the 20-day high, and the RSI rebound from below 35. The main counterweight is the overbought stochastic reading, alongside the price’s close above the upper Bollinger Band. - Ideal entry range: $161.51–$170.97, using the ATR-based reference and 20-day resistance as the range boundaries. - Exit target: $217.32, the next major resistance reference at the three-month high, if BKNG establishes a break above $170.97. - Stop-loss protection: Below $147.94, the 20-day support; a fall below that level invalidates the bullish verdict. The chart signals favor further strength, but the overbought reading means the advance remains vulnerable to a sharp pause. For non-traders, the indicators lean positive, but the rally’s speed makes a pullback a meaningful risk.Summary Data BKNG
| Last price | 170.97 USD |
| Change 1 day / 5 days / 1 month | 9.83% / 15.57% / 9.69% |
| Trend / MA-cross | sideways / none |
| SMA20 / SMA50 | 157.91 / 168.14 |
| RSI (14) / Stochastic %K | 61.0 / 88.8 |
| Bollinger %B / ATR | 105% / 6.31 |
| Support / Resistance 20 days | 147.94 / 170.97 |
| Data as of | 5 November 2026 04:00 WIB |
Disclaimer: This technical analysis is generated automatically from exchange data and indicators calculated by JournalArta, for information and education only. The verdict and the entry, target and stop-loss levels are not investment advice or a solicitation to buy or sell any security. Investment decisions and their risks rest solely with the reader.
Track BKNG stock price daily: live levels, support/resistance and our full BKNG analysis history.