3M Stock Gains 9.55% on Wednesday, RSI Overbought
On November 4, 2026: price 193.95 USD, trend uptrend, RSI 75.1, support 159.96, resistance 193.95. technical analysis of 3m stock. Stock Gains — full details…

Why 3M is in focus today
- One-day move of 9.55%, about 3.3× its average daily range (ATR)
- Volume at 2.4× the 20-day average
- Closed at a 20-day high (193.95)
- Trading near its 3-month high (194.77)
- Fresh golden cross: SMA20 crossed above SMA50
- RSI(14) at 75.1 — overbought zone
- Uptrend confirmed (5-day change 12.24%)
- Not covered by JournalArta in the last 14 days
Selected automatically from 80 NYSE (US) stocks by a technical-signal score with daily weighted randomisation — not a recommendation.
Trend & Price Action
3M’s shares rose 12.24% over five days and 19.63% over one month. The close was above both the 20-day simple moving average, at $170.86, and the 50-day average, at $168.71. A simple moving average tracks the mean closing price over a set number of trading days; when the shorter average crosses above the longer one, it is called a golden cross and can indicate an improving trend. That cross formed two sessions before the latest session, rather than on the day of the surge. The price finished at the 20-day resistance of $193.95, just below the three-month high of $194.77. The 20-day average’s slope was positive, rising 2.62% over five days, reinforcing the upward trend rather than merely reflecting a single strong close. The golden cross and rising averages support the bullish structure, but the close at resistance leaves little room before the three-month peak. A move above that peak would place the stock in uncharted territory within the supplied reference levels; failure to clear it could leave the price vulnerable to a pullback. As shown in the chart, the price sits above its moving averages and above the upper Bollinger Band, while the marked resistance is close to the three-month high.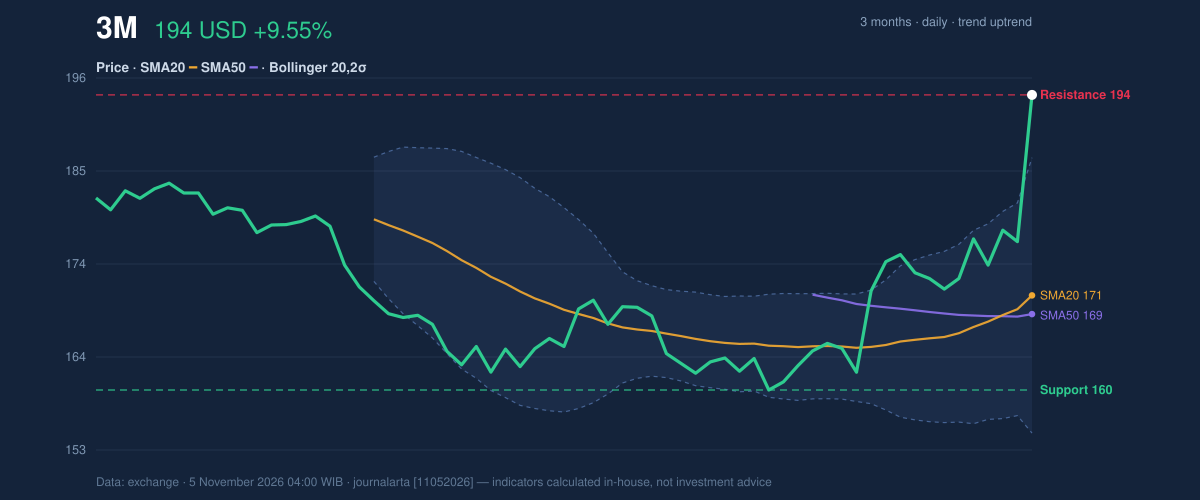
Oscillators & Momentum
Momentum indicators confirm the force of the rally, but they also warn that buyers may have pushed the stock too far, too quickly. The RSI is 75.1, in overbought territory; the Relative Strength Index compares recent gains and losses, and readings above 70 are commonly treated as a sign that an asset has risen sharply. The Stochastic readings are also overbought, with %K at 97.5 and %D at 90.3. These readings do not prove that a reversal is imminent, but they raise the risk that gains could pause or retrace. The MACD is positive at 4.076, above its 2.045 signal line, with a positive 2.031 histogram. That alignment indicates upward momentum remains intact. Yet momentum confirmation and overbought conditions can coexist: the trend is strong, while the risk of short-term exhaustion is elevated. The chart places RSI, MACD and Stochastic together, showing that positive MACD momentum is running alongside stretched RSI and Stochastic readings.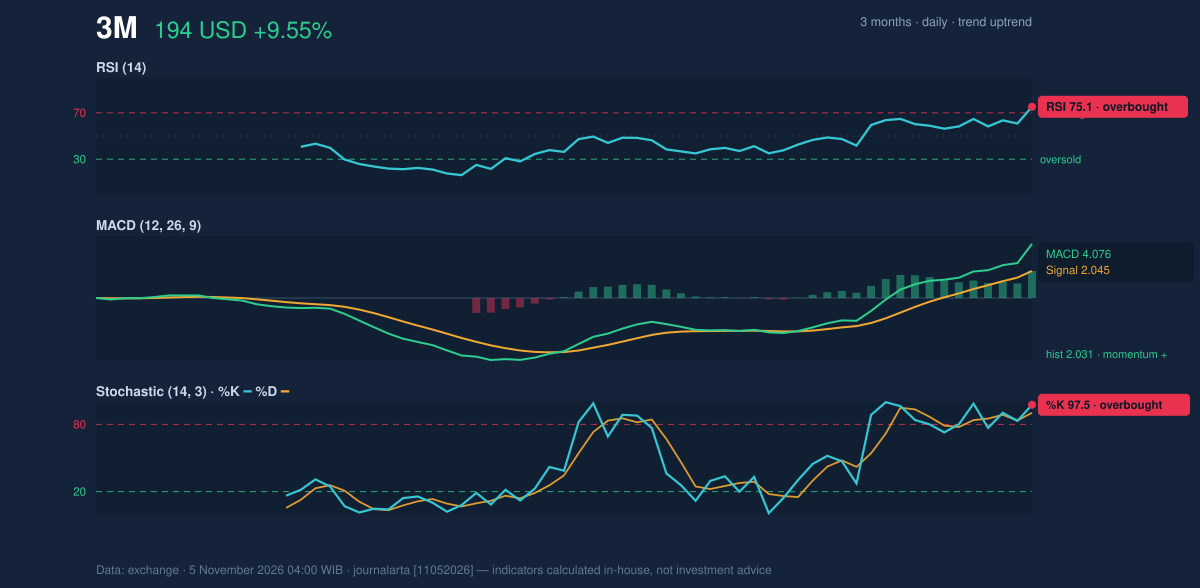
Volatility, Volume & Key Levels
Volume reached 9,052,800 shares, against a 20-day average of 3,784,420. That surge, alongside rising on-balance volume (OBV)—a measure that tracks whether trading volume is accumulating on up days or down days—supports the view that the advance attracted broader participation. The signal is more convincing than a price rise on thin trading, though a single session cannot establish whether participation will persist. The Bollinger Band position adds a caution. Bollinger Bands measure price relative to a moving average and its surrounding volatility range; 3M’s %B of 123% puts the close above the upper band of $186.72. The band width was 18.6%, described as normal, so the data do not show a squeeze—a period of unusually narrow bands that can precede a larger move. ATR, a measure of typical price movement, stood at $5.59, or 2.9% of the share price, indicating moderate volatility. The one-day gain of 9.55% was about 3.3 times that average range. The immediate test is resistance at $193.95, followed by the three-month high at $194.77. A sustained break above the high would be a stronger sign that the rally can extend; a failure to hold the breakout zone could bring attention back to $185.56, the price minus 1.5 times ATR. The broader 20-day support is $159.96, with the three-month low at $159.21.Fundamental Context
According to its SEC filing, 3M reported quarterly revenue of $6.58 billion for the quarter ended September 30, up 1.0% from $6.52 billion a year earlier. Net income was $1.37 billion, compared with $834.0 million a year earlier, while diluted earnings per share were $2.63. These results provide a stronger earnings backdrop, but the modest revenue growth shows that the sharp share move should not be read as evidence of equally rapid sales expansion.Technical Verdict: BUY
The data’s technical bias is bullish, supported by the golden cross, a close above the 20-day high on volume at least 1.5 times average, and rising OBV. The main counterweight is the overbought RSI and Stochastic, alongside a close above the upper Bollinger Band. - Ideal entry range: $185.56–$193.95, using the ATR-based reference and 20-day resistance as the boundaries. - Exit target: $194.77, the next reference resistance at the three-month high. - Stop-loss protection: Below $185.56, the price-minus-1.5×ATR level. - Invalidation: The bullish verdict is invalidated if the price falls below $159.96, the 20-day support. In plain English, the trend favors further strength, but the rally is stretched and a pullback would not by itself erase the longer-term technical support.Summary Data 3M
| Last price | 193.95 USD |
| Change 1 day / 5 days / 1 month | 9.55% / 12.24% / 19.63% |
| Trend / MA-cross | uptrend / golden |
| SMA20 / SMA50 | 170.86 / 168.71 |
| RSI (14) / Stochastic %K | 75.1 / 97.5 |
| Bollinger %B / ATR | 123% / 5.59 |
| Support / Resistance 20 days | 159.96 / 193.95 |
| Data as of | 5 November 2026 04:00 WIB |
Disclaimer: This technical analysis is generated automatically from exchange data and indicators calculated by JournalArta, for information and education only. The verdict and the entry, target and stop-loss levels are not investment advice or a solicitation to buy or sell any security. Investment decisions and their risks rest solely with the reader.
Track 3M stock price daily: live levels, support/resistance and our full 3M analysis history.