SPG Stock Gains 2.89% on Wednesday, RSI Overbought
On November 4, 2026: price 228.50 USD, trend uptrend, RSI 78.3, support 198.70, resistance 228.50. technical analysis of spg stock. Peak — full details here.

Why SPG is in focus today
- One-day move of 2.89%, about 1.7× its average daily range (ATR)
- Closed at a 20-day high (228.50)
- Trading near its 3-month high (228.70)
- Fresh golden cross: SMA20 crossed above SMA50
- RSI(14) at 78.3 — overbought zone
- Uptrend confirmed (5-day change 8.17%)
- Not covered by JournalArta in the last 14 days
Selected automatically from 80 NYSE (US) stocks by a technical-signal score with daily weighted randomisation — not a recommendation.
Trend & Price Action
SPG is above both its 20-day simple moving average (SMA), at $209.47, and its 50-day average, at $207.51. The 20-day average rose 2.53% over five days, indicating that the underlying trend is strengthening rather than merely reflecting a single session’s jump. A golden cross—when the shorter-term average moves above the longer-term one—formed one session before the latest session. That is a constructive trend signal, though it does not establish how long the advance can continue. The price has also moved above the upper Bollinger Band, which sits at $226.15. Bollinger Bands track price relative to a moving average and widen or contract with volatility; a close above the upper band can signal strong buying pressure, but it can also mark a market that has run ahead of its recent range. SPG’s band width is 15.9%, described as normal, rather than unusually compressed. The stock is at the 20-day resistance of $228.50 and just below its three-month high of $228.70, leaving little overhead room before those reference levels are tested. The price structure is bullish, but the breakout is not yet confirmed by a sustained move beyond the nearby highs. As shown in the chart, the gap between the current price and the moving averages is substantial, so a pullback could occur without immediately overturning the broader uptrend.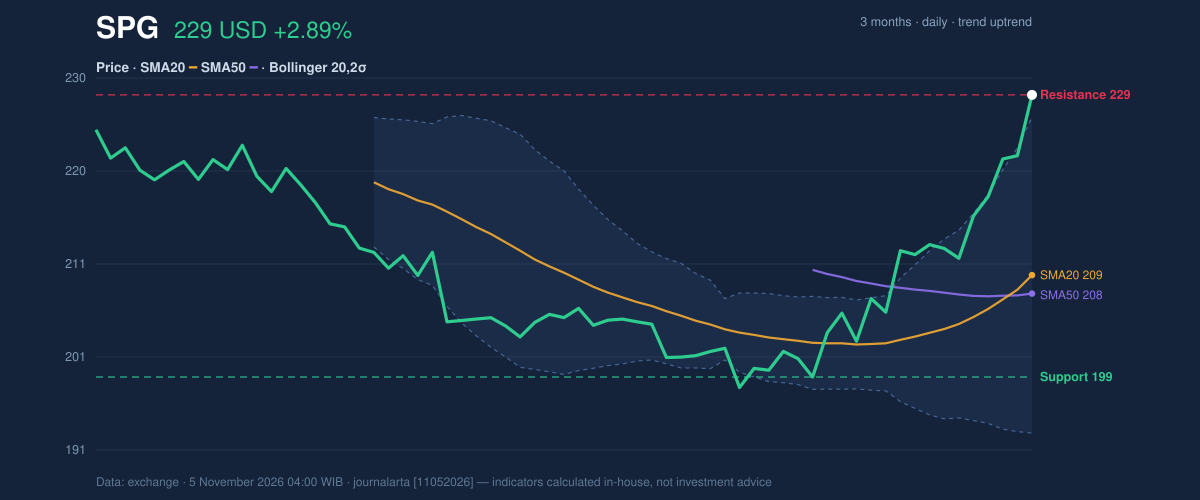
Oscillators & Momentum
Momentum measures confirm the strength of the advance but also show crowding. The relative strength index (RSI), a gauge of recent gains versus losses, is 78.3, in overbought territory. The Stochastic reading is similarly elevated, with %K at 99.2 and %D at 95.2. Both RSI and Stochastic signal overbought conditions; that means prices have risen quickly relative to their recent history, not that a reversal is certain. The moving average convergence divergence indicator (MACD), which compares short- and longer-term price momentum, remains positive: its reading is 4.668, above the 2.380 signal line, with a positive histogram of 2.288. This supports the trend, although the oscillators’ extreme readings warn that momentum may be vulnerable to cooling. The latest one-day gain was about 1.7 times the average daily range implied by the 14-day average true range (ATR), adding to the evidence of an unusually strong session.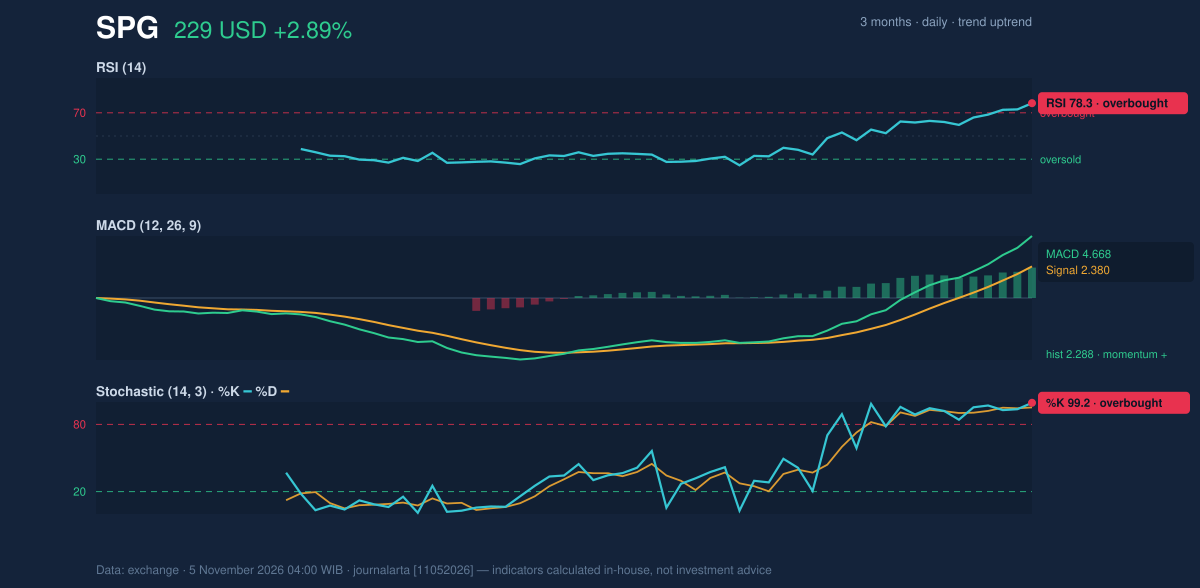
Volatility, Volume & Key Levels
Volume was above its 20-day average and on-balance volume (OBV), a cumulative measure that tracks whether volume accompanies rising or falling prices, is increasing. Rising OBV supports the advance by showing participation behind the price move, rather than a rise occurring on thinning activity. The ATR is $3.95, or 1.7% of the share price, indicating moderate volatility by the supplied measure. SPG closed at the top of its 20-day range, with support at $198.70 and resistance at $228.50. The three-month low is $196.76. A sustained move above the three-month high of $228.70 would put the near-term breakout question to a clearer test; failure to hold above the recent resistance area could instead leave the stock exposed to a retreat toward its moving averages. The reference level of $222.57—price minus 1.5 times ATR—offers a nearer volatility-based marker, not a guaranteed floor.Fundamental Context
According to its SEC filing, Simon Property Group reported revenue of $1.79 billion for the quarter ended June 30, 2026, up 19.5% from $1.50 billion a year earlier. Net income was $483.1 million, compared with $556.1 million a year earlier, while diluted earnings per share were $1.49. The revenue increase and lower net income show why the market’s technical strength should be considered separately from the quarter’s mixed earnings picture.Technical Verdict: HOLD (wait & see)
The supplied technical bias is neutral, despite zero of seven bearish signals, because only two of seven bullish signals are present: the recent golden cross and rising OBV. The uptrend and positive MACD support the advance, but RSI at 78.3 and Stochastic at 99.2/95.2 flag stretched momentum, while price is already at 20-day resistance. The verdict is invalidated if price falls below $198.70, the 20-day support. - Ideal entry range: $209.47–$222.57, bounded by the 20-day SMA and the price-minus-1.5×ATR reference. - Exit target: $228.70, the three-month high above the 20-day resistance. - Stop-loss protection: $198.70, the 20-day support. In plain English, the trend is strong, but the stock is close to a ceiling and momentum is overheated, so the technical reading remains a wait-and-see.Summary Data SPG
| Last price | 228.50 USD |
| Change 1 day / 5 days / 1 month | 2.89% / 8.17% / 15.64% |
| Trend / MA-cross | uptrend / golden |
| SMA20 / SMA50 | 209.47 / 207.51 |
| RSI (14) / Stochastic %K | 78.3 / 99.2 |
| Bollinger %B / ATR | 107% / 3.95 |
| Support / Resistance 20 days | 198.70 / 228.50 |
| Data as of | 5 November 2026 04:00 WIB |
Disclaimer: This technical analysis is generated automatically from exchange data and indicators calculated by JournalArta, for information and education only. The verdict and the entry, target and stop-loss levels are not investment advice or a solicitation to buy or sell any security. Investment decisions and their risks rest solely with the reader.
Track SPG stock price daily: live levels, support/resistance and our full SPG analysis history.