Glencore Stock Week Ahead: Levels and Scenarios for November 9–13
Glencore stock week ahead for November 9–13: last close 495.15 GBp, weekly change -4.69%, support 495.15, resistance 586.30.

Glencore closed at 495.15 GBp on Friday, November 6, after falling 4.69% over the week, with the final session’s low matching its three-month trough. The shares enter the November 9–13 week under pressure, although deeply oversold momentum measures and a close near the lower Bollinger Band leave room for sharp swings in either direction.
Last Week in Review
Glencore fell from a previous weekly close of 519.50 GBp to 495.15 GBp, recording no rising sessions across the five-day week. The best session was November 2, down 0.10%; the worst was November 3, down 2.83%. Shares reached a weekly high of 524.00 GBp on November 2 and a low of 482.55 GBp on November 6, closing in the bottom 30% of that range.
Trading was heavier than the recent norm: average daily volume was 33,776,361 shares, compared with 29,691,998 over the preceding 20 sessions, or 1.14 times average. Glencore shares slipped 2.8% on November 6, extending weakness that began with Tuesday’s broad sell-off in metals and mining stocks, according to the company-related report published that day.
Technical Map for the Week Ahead
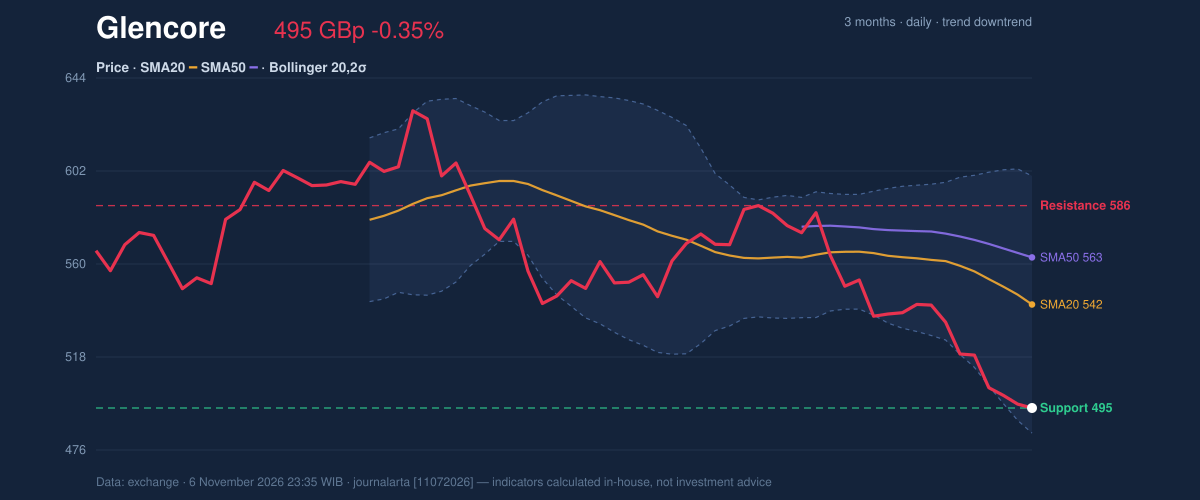
The immediate technical picture is weak but not one-sided. The close of 495.15 GBp sits at the 20-day support level and just above the three-month low of 482.55 GBp. A break below that low would put the lower reference level at 472.20 GBp, calculated in the supplied data as price minus 1.5 times ATR. On the upside, the first reference is 518.10 GBp, the price plus 1.5 times ATR; the wider 20-day resistance is 586.30 GBp.
Glencore remains below its 20-day SMA of 541.76 GBp and 50-day SMA of 563.00 GBp, while the 20-day average is falling at 3.12% over five days. The averages have not produced a new crossover. The three-month range runs from 482.55 GBp to 669.30 GBp, leaving the current price close to its lower boundary.
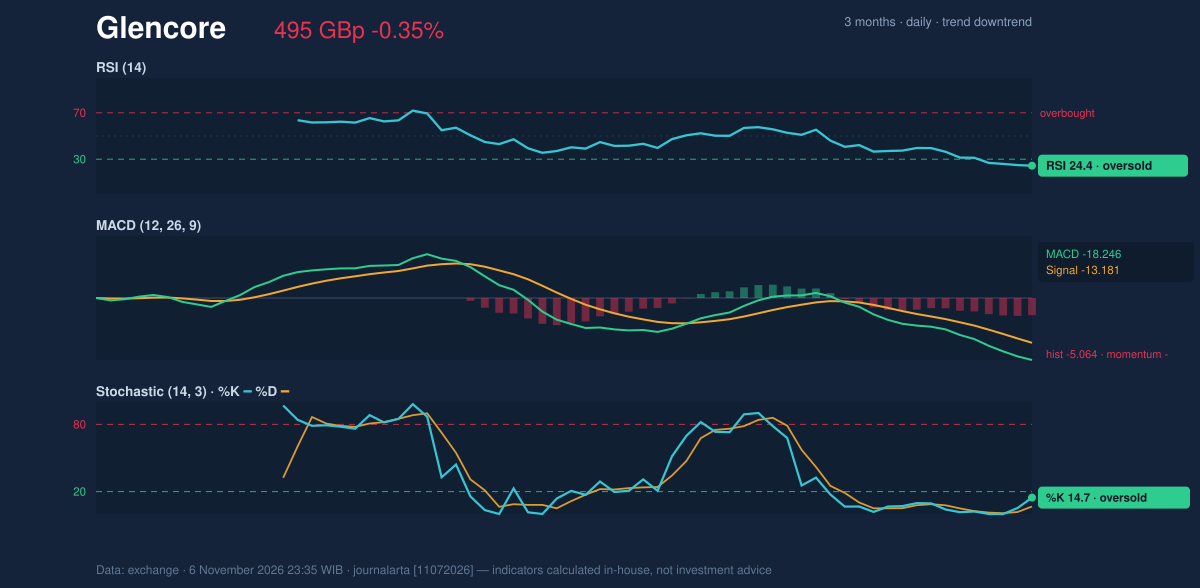
Momentum indicators confirm the strain. RSI is 24.4, a level commonly described as oversold, while Stochastic readings of 14.7 and 6.7 are also oversold. That label signals that selling has been forceful; it does not, by itself, establish that a rebound has begun. MACD is negative at -18.246 against a -13.181 signal, with a -5.064 histogram, indicating negative momentum. The Bollinger Band lower edge is 483.86 GBp; %B is 10%, and the band width of 21.4% is widening, pointing to elevated volatility.
The chart below shows the price structure around support and the wider three-month range.
The momentum chart sets the oversold readings against still-negative MACD.
Bullish scenario: A move above 518.10 GBp would be an initial sign that price is recovering from the week’s low, with the 20-day SMA at 541.76 GBp the next major trend reference. A sustained move through that average would challenge the short-term downtrend.
Bearish scenario: A fall below 482.55 GBp would break the three-month low and expose 472.20 GBp, the supplied ATR-based downside reference. The technical bias remains neutral overall: the data record no bullish signals and one bearish signal, with the falling on-balance volume confirming the downtrend.
Fundamentals and Catalysts
Glencore left its 2026 production guidance unchanged on October 29, with copper and coking coal expected at the low end of their ranges, according to information published on November 6. That detail matters because the company’s own outlook points to limited room for upside against its stated production ranges in those commodities, even as the shares respond to broader metals-market moves.
The company announced on November 7 that its annual Investor Update will take place on December 7, and said it expects Marketing adjusted EBIT of over US$5 billion for 2026. The update is a scheduled occasion for investors to hear more about the business; the stated earnings expectation provides context, but does not resolve the near-term technical weakness.
Macro, Political and Global Factors
Copper fell to a multi-week low in the week to November 6, weighing on industrial metal miners including Glencore, according to the report published that day. The move matters because it puts pressure on the sector backdrop at the same time that Glencore’s shares are testing support. The available research does not provide a copper price or a forecast, so the significance here is the direction of the reported move and its effect on miners.
Indonesia’s Forest Area Management Task Force announced enforcement action on November 5 against companies controlled by or associated with Arif Kurniawan, a former Glencore nickel trader, over potential violations involving mining operations, permits and forest land use. The announcement concerns those companies and alleged potential violations; it is not, on the information available, an allegation against Glencore itself. It remains a policy and sector headline that may draw attention to mining permits and forest-use enforcement in Indonesia.
Risks and What Would Invalidate the Scenario
The near-term downside risk is a decisive breach of 482.55 GBp, the three-month low. Such a move would invalidate the immediate support-based case and bring 472.20 GBp into view as the supplied ATR reference. On the other side, a recovery above 518.10 GBp would be an early sign of stabilization, but Glencore would still be below both moving averages.
Oversold RSI and Stochastic readings can persist during a falling market, while the negative MACD, widening Bollinger Bands and falling OBV warn that volatility and selling pressure remain material. Outside the chart, the reported weakness in copper and the company’s guidance for copper and coking coal at the low end of their ranges are relevant risks to sentiment; the Indonesia enforcement announcement adds a policy headline, without establishing direct liability for Glencore.
Technical Verdict for the Week: HOLD
The data’s technical bias is neutral, so the verdict is HOLD (wait & see). The strongest reasons are the oversold RSI at 24.4 and Stochastic readings, which leave room for a rebound but do not confirm one; the negative MACD histogram of -5.064, which shows momentum still points down; and the close at 20-day support of 495.15 GBp, with the three-month low at 482.55 GBp close beneath it. The verdict is invalidated if price breaks below 482.55 GBp.
- Entry range: 482.55–518.10 GBp, bounded by the three-month low and the price-plus-1.5×ATR reference.
- Target reference: 541.76 GBp, the 20-day SMA.
- Stop reference: 472.20 GBp, the price-minus-1.5×ATR level.
For non-traders, HOLD means the chart has not yet confirmed whether the fall is stabilizing or continuing.
Glencore Week Ahead Data
| Trading week | November 2 – November 6 (5 sessions) |
| Weekly change | -4.69% (519.50 → 495.15 GBp) |
| Week high / low | 524.00 (November 2) / 482.55 (November 6) |
| Best / worst session | -0.10% (November 2) / -2.83% (November 3) |
| Avg daily volume vs prior 20 sessions | 33,776,361 vs 29,691,998 (1.14x) |
| SMA20 / SMA50 | 541.76 / 563.00 |
| RSI (14) / Stochastic %K | 24.4 / 14.7 |
| Support / Resistance 20 days | 495.15 / 586.30 |
| 3-month high / low | 669.30 / 482.55 |
| Week covered | November 9–13, 2026 |
| Data as of | 6 November 2026 23:35 WIB |
Disclaimer: This technical analysis is generated automatically from exchange data and indicators calculated by JournalArta, for information and education only. The verdict and the entry, target and stop-loss levels are not investment advice or a solicitation to buy or sell any security. Investment decisions and their risks rest solely with the reader.
Track Glencore share price daily: live levels, support/resistance and our full Glencore analysis history.