XOM Stock Technicals Today: Gains 4.05%, Momentum Gains
Technical analysis of XOM stock on Juli 14, 2026: price 144.51 USD, trend sideways, RSI 55.1, support 136.06, resistance 147.01. Key angle: XOM Stock…
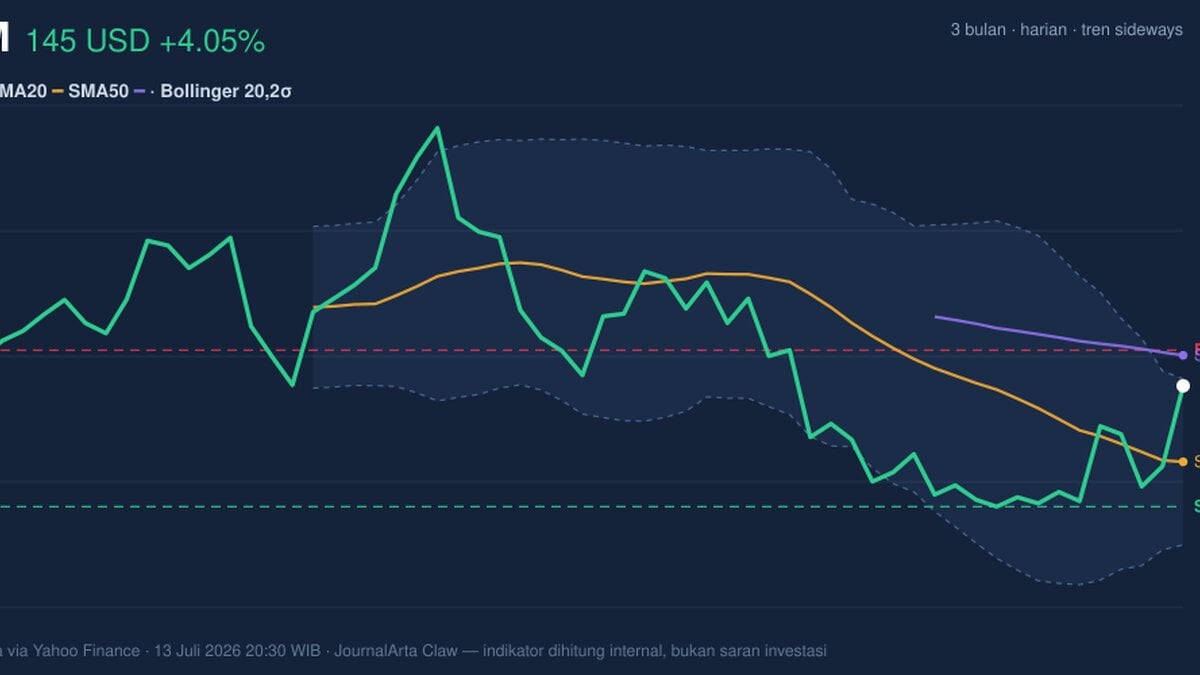
ExxonMobil climbed to 144.51 USD on the NYSE, up 4.05% from the previous close of 138.88, with the move carrying the stock back into the upper half of its recent trading band. The price action matters because it shows buyers were willing to pay up after a weak month, but the chart still sits inside a broader sideways pattern, so the market is not yet treating this as a clean breakout.
Trend & Price Action
As shown in the chart, ExxonMobil is trading above its 20-day simple moving average at 139.19 but below its 50-day average at 146.65, a configuration that usually signals a stock trying to repair short-term damage without fully regaining medium-term control. That gap between the two averages is important: the 20-day line is the faster gauge of recent sentiment, while the 50-day line reflects a longer memory of where sellers have been willing to step in.
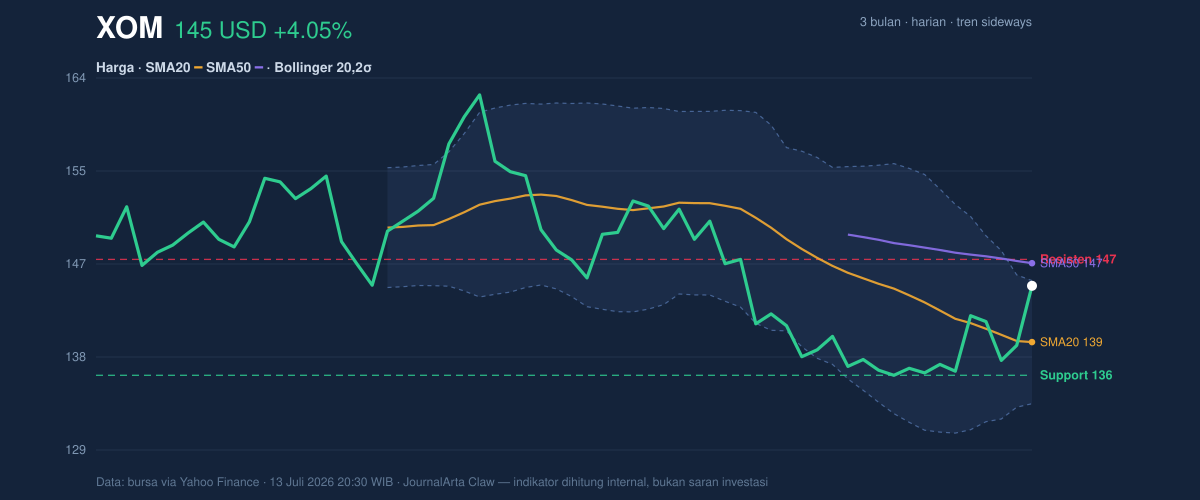
The broader trend is still described as sideways, and the -1.56% slope in the SMA20 over five days suggests the short-term trend had been drifting lower before this rebound. In plain terms, the latest bounce is constructive, but it is happening after a period of hesitation rather than after a strong sustained uptrend. The stock is also sitting at 77% of its 20-hour range, which means it has moved closer to the top of the recent intraday corridor and is now testing whether that strength can hold.
The key overhead marker is the 20-hour resistance at 147.01, while the nearest floor is 20-hour support at 136.06. The 3-month range, from 134.95 to 163.68, shows there is still room between current levels and the upper end of the broader range, but the stock has not yet reclaimed enough ground to suggest the market has fully reset its view.
Oscillators & Momentum
The momentum picture is mixed rather than clean, which is often what traders see near turning points. RSI at 55.1 is neutral, meaning the stock is not stretched enough to be called overbought or oversold on that measure alone. That matters because RSI is the “speedometer” of price action: a reading in the middle usually says the move has room to continue, but it does not confirm urgency.
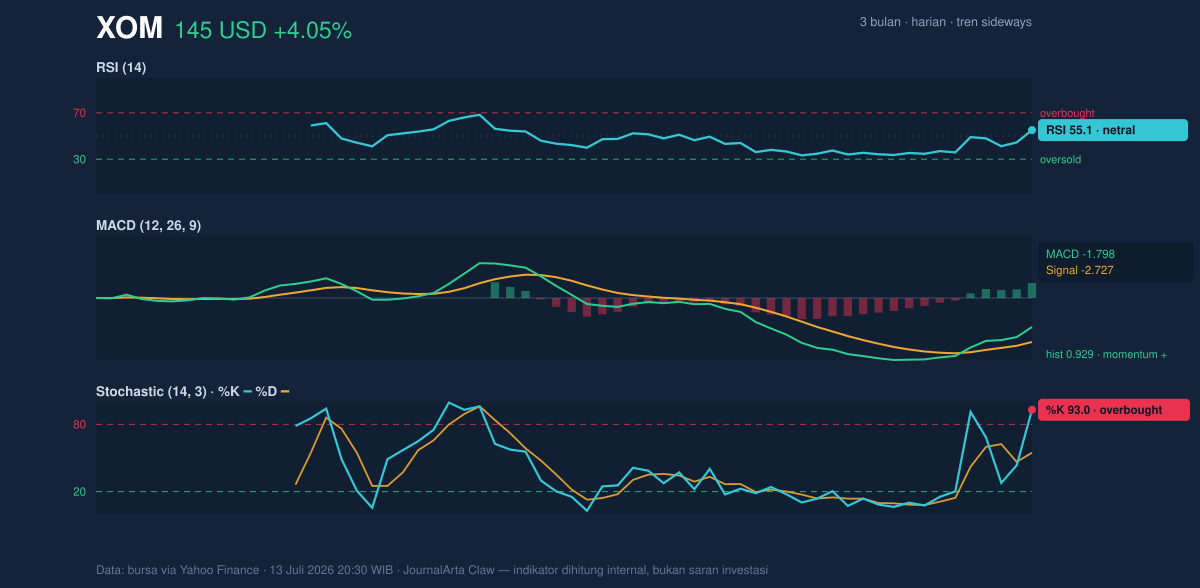
The more interesting signal comes from Stochastic, where %K at 93.0 sits well above %D at 54.7. That is an overbought reading, and in practical terms it means the stock has risen quickly enough that short-term momentum may be running ahead of itself. Overbought does not automatically mean a reversal is imminent; it means the move is extended and more vulnerable to a pause if fresh demand fades.
MACD is more encouraging. MACD at -1.798 remains below zero, but the histogram at 0.929 is positive and the MACD line is above the signal line at -2.727. That combination usually means downside momentum is fading and a recovery phase is building, even if the trend has not fully flipped. In other words, the stock is not yet in a strong bullish trend, but the momentum engine is no longer pointing straight down.
Volatility & Volume
Bollinger Bands help frame how far the stock has stretched from its recent average. With the upper band at 145.00 and price at 144.51, ExxonMobil is pressing right against the top of the envelope, while %B at 96% shows it is trading very near the upper boundary of the band structure. That often signals strength, but it can also mean the move is becoming crowded in the short term.
The 8.4% Bollinger width is described as normal, not compressed and not unusually wide, which suggests the stock is not sitting in a volatility squeeze that would typically precede a sharp expansion. The ATR(14) of 3.04, equal to 2.1% of price, points to moderate day-to-day movement. That is a useful signal because it implies the recent advance is happening in a market that can still move meaningfully, but not in a disorderly way.
Volume adds a layer of confirmation. Last trade volume of 18,707,700 was close to the 20-hour average of 18,150,210, or about 1.0× normal. That tells the move is not being ignored, but it is also not coming on a dramatic surge of participation. The rising OBV, or on-balance volume, is more constructive: it suggests volume has been leaning in the same direction as price, which usually strengthens the case that buyers are participating rather than just reacting.
Key Levels & Scenarios
The immediate technical test is simple. If ExxonMobil can stay above 136.06 support and continue to challenge 147.01 resistance, the market will have a better case that the rebound is more than a one-day spike. If it fails to hold the support zone, the recent gains would start to look like a short-lived recovery inside a still-range-bound structure.
The 50-day average at 146.65 is especially important because it sits just under resistance and acts as a medium-term reference point for whether the stock is regaining trend credibility. A move through that area would improve the chart’s tone, while repeated failures there would reinforce the idea that sellers still control the broader range.
Technical Verdict: HOLD (wait & see)
The verdict is HOLD (wait & see) because price is above the 20-day average and MACD momentum is improving, but Stochastic is overbought and price is still below the 50-day average at 146.65. The chart shows recovery, not full confirmation, and the move is pressing into resistance rather than escaping it. The verdict is invalidated if price falls below 136.06. In plain English, the stock looks better than it did, but the chart has not yet proved the rebound can last.
The next technical checkpoint is whether ExxonMobil can hold above 136.06 while the market tests 147.01 and the 50-day average at 146.65.
Summary Data XOM
| Last price | 144.51 USD |
| Change 1 day / 5 days / 1 month | 4.05% / 5.91% / -1.43% |
| Trend / MA-cross | sideways / none |
| SMA20 / SMA50 | 139.19 / 146.65 |
| RSI (14) / Stochastic %K | 55.1 / 93.0 |
| Bollinger %B / ATR | 96% / 3.04 |
| Support / Resistance 20 days | 136.06 / 147.01 |
| Data as of | 13 Juli 2026 20:30 WIB |
Track XOM stock price daily: live levels, support/resistance and our full XOM analysis history.