Diageo Stock Gains 2.14% on Monday, Testing Key Resistance
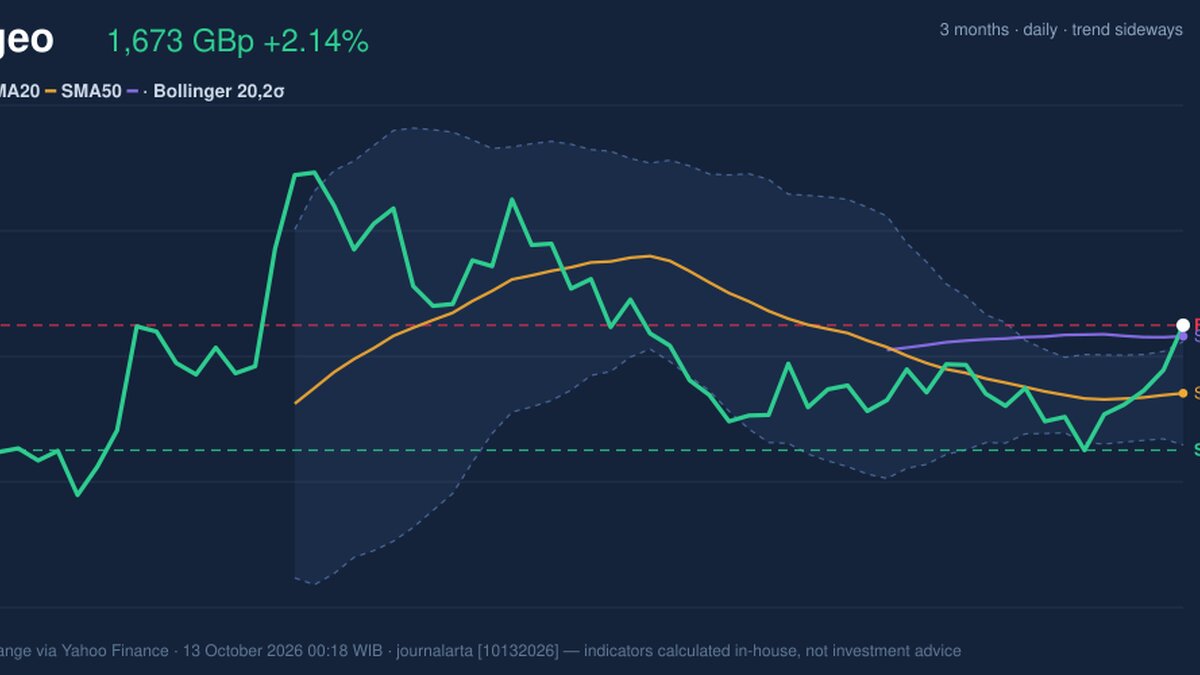
On October 12, 2026: price 1,673.00 GBp, trend sideways, RSI 59.0, support 1,575.50, resistance 1,673.00. technical analysis of diageo stock.
Trend & Price Action
The price is above its 20-day simple moving average (SMA), a measure of the recent average share price, at 1,619.90 GBp, and just above the 50-day SMA at 1,664.37 GBp. The 20-day average has edged higher, but there is no new moving-average crossover to confirm a change in the broader trend. That leaves the chart sideways overall, despite the recent advance. The key signal is the close at 1,673.00 GBp, the top of the 20-day range. It is also above the Bollinger upper band at 1,660.24 GBp. Bollinger bands track price relative to recent volatility; a close outside the upper band can reflect strong buying pressure, but it can also mean the price has moved ahead of its short-term average. The band width has narrowed to 5.0% before this move, suggesting a period of unusually compressed trading that has now begun to resolve. There is a breakout attempt, but confirmation is still thin.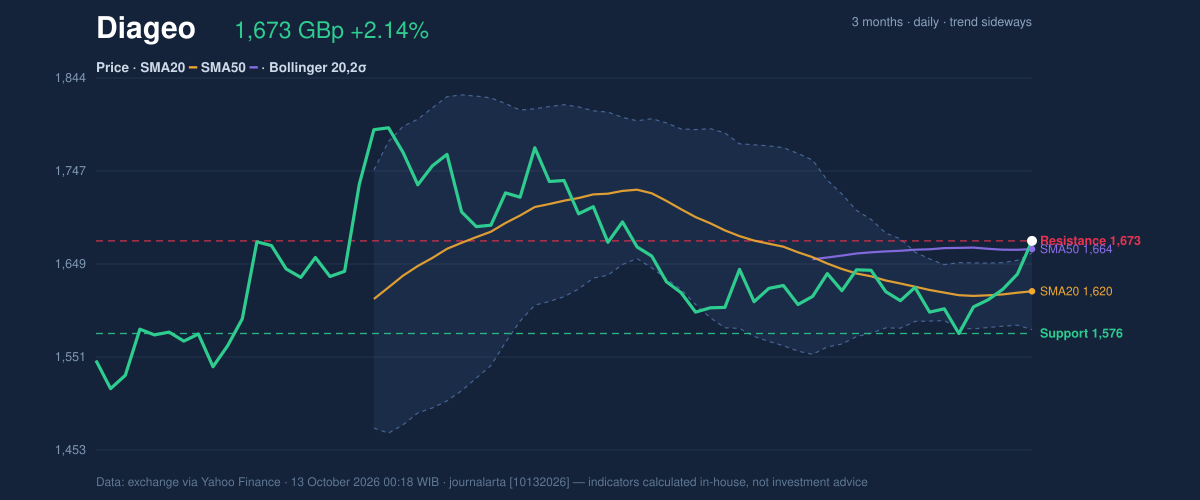
Oscillators & Momentum
Momentum indicators are mixed rather than uniformly bullish. The RSI, which measures the pace of recent price moves, is 59.0 and remains neutral. The MACD histogram has turned positive at 6.825, with MACD at -4.504 above its signal line at -11.330. That configuration indicates improving momentum, although both MACD readings remain below zero, so the recovery has not yet fully reversed the weaker trend implied by the indicator. By contrast, the Stochastic reading is stretched: %K is 100.0 and %D is 74.6, an overbought signal. This does not by itself predict a fall, but it warns that the latest rise may be vulnerable to a pause or pullback. The RSI’s neutral reading provides some counterweight; the indicators do not show broad-based overheating.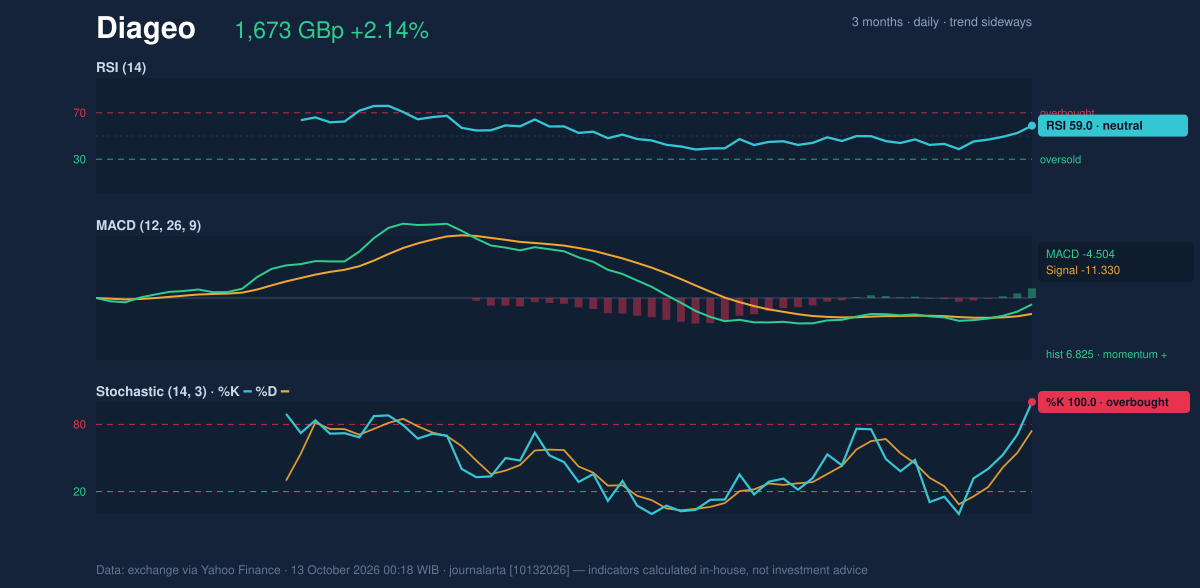
Volatility & Volume
The breakout is occurring after a squeeze in the Bollinger bands, but the shares are already above the upper band, with %B at 116%. In plain terms, the close sits beyond the band’s usual range, making follow-through important. The 14-day average true range (ATR), a measure of typical price movement, is 148.54 GBp, or 8.9% of the share price. That is high volatility: moves around chart levels may be wide, and brief reversals would not necessarily settle the direction. Trading activity raises a separate caution. The reported latest volume was 16 against a 20-day average of 4,787,628, effectively negligible by comparison. The data labels volume as thin, so the price move lacks clear volume confirmation. On the more constructive side, on-balance volume (OBV), which tracks buying and selling pressure through volume, is rising. Taken together, the indicators suggest improving underlying momentum but an unconvincing day of participation.Key Levels & Scenarios
The immediate test is whether the price can hold above 1,673.00 GBp, the 20-day resistance and the top of the stated range. A sustained move above that level would strengthen the breakout case; failure to hold it would leave the close beyond the upper Bollinger band looking more like a short-term extension than a confirmed trend shift. The first important downside reference is the 1,664.37 GBp 50-day SMA, followed by the 1,619.90 GBp 20-day SMA. The 20-day support is 1,575.50 GBp. A fall through that support would invalidate the constructive breakout reading. The three-month high is 1,827.93 GBp, but the supplied data do not establish it as an immediate target; the three-month low is reported as 0.00 and is not a usable trading reference.Technical Verdict: HOLD (wait & see)
The technical verdict is HOLD (wait & see) because the price has reached resistance on exceptionally thin reported volume, while the overbought Stochastic and high ATR raise the risk of a volatile pullback. Positive MACD momentum and rising OBV are supportive, but they do not yet confirm a durable breakout. The verdict is invalidated if the price falls below 1,575.50 GBp.- Ideal Entry Range: 1,619.90–1,664.37 GBp, anchored to the 20-day and 50-day SMAs.
- Exit Target (Target Price): 1,673.00 GBp, the stated 20-day resistance level.
- Stop Loss protection: 1,575.50 GBp, the stated 20-day support.
Data source: London Stock Exchange market data via Yahoo Finance, as of 13 October 2026, 00:18 WIB.
Why Diageo is in focus today
- Closed at a 20-day high (1,673.00)
- Breaking out of a Bollinger squeeze (band width 5.0%)
Selected automatically from 16 LSE (UK) stocks by a technical-signal score with daily weighted randomisation — not a recommendation.
Summary Data Diageo
| Last price | 1,673.00 GBp |
| Change 1 day / 5 days / 1 month | 2.14% / 6.19% / 1.83% |
| Trend / MA-cross | sideways / none |
| SMA20 / SMA50 | 1,619.90 / 1,664.37 |
| RSI (14) / Stochastic %K | 59.0 / 100.0 |
| Bollinger %B / ATR | 116% / 148.54 |
| Support / Resistance 20 days | 1,575.50 / 1,673.00 |
| Data as of | 13 October 2026 00:18 WIB |
Disclaimer: This technical analysis is generated automatically from exchange data (via Yahoo Finance) and indicators calculated by JournalArta, for information and education only. The verdict and the entry, target and stop-loss levels are not investment advice or a solicitation to buy or sell any security. Investment decisions and their risks rest solely with the reader.
Track Diageo share price daily: live levels, support/resistance and our full Diageo analysis history.