Unilever Testing Key Resistance: Stock Gains 1.38% (October 12, 2026)
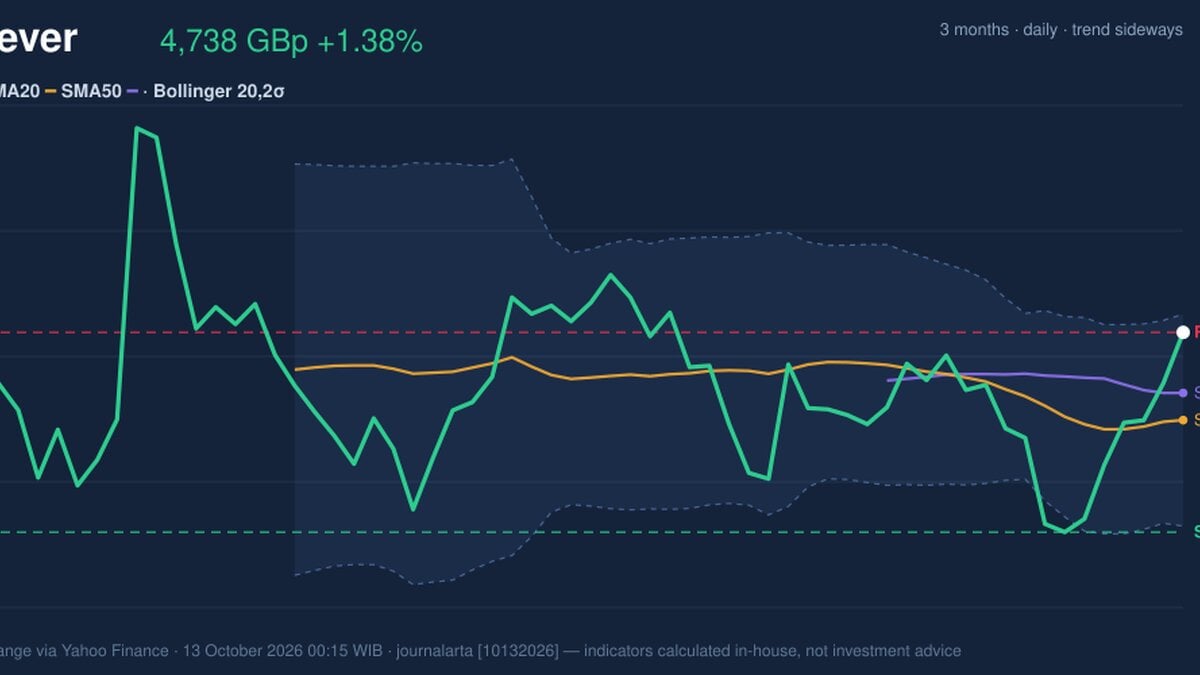
On October 12, 2026: price 4,738.00 GBp, trend sideways, RSI 59.7, support 4,483.50, resistance 4,738.00. technical analysis of unilever stock.
Why Unilever is in focus today
- Closed at a 20-day high (4,738.00)
- Not covered by JournalArta in the last 14 days
Selected automatically from 16 LSE (UK) stocks by a technical-signal score with daily weighted randomisation — not a recommendation.
Trend & Price Action
The share price is above its 20-day simple moving average (SMA) of 4,626.15 GBp, while the 20-day average remains just below the 50-day average of 4,660.73 GBp. There has been no new moving-average crossover. That combination points to a modest short-term recovery within a broader sideways pattern, rather than an established uptrend. The 20-day average’s slope is only 0.11% over five days. The price has risen 5.28% in five sessions, although its one-month gain is a more restrained 0.87%. That gap suggests the recent push is concentrated in the short term. At 4,738.00 GBp, the stock is also at the stated 20-day resistance, leaving little room within that range for further gains without a break above it. The shares are pressing against resistance, but the moving averages have not yet confirmed a trend change. The chart shows the price alongside the moving averages, Bollinger bands and support and resistance levels.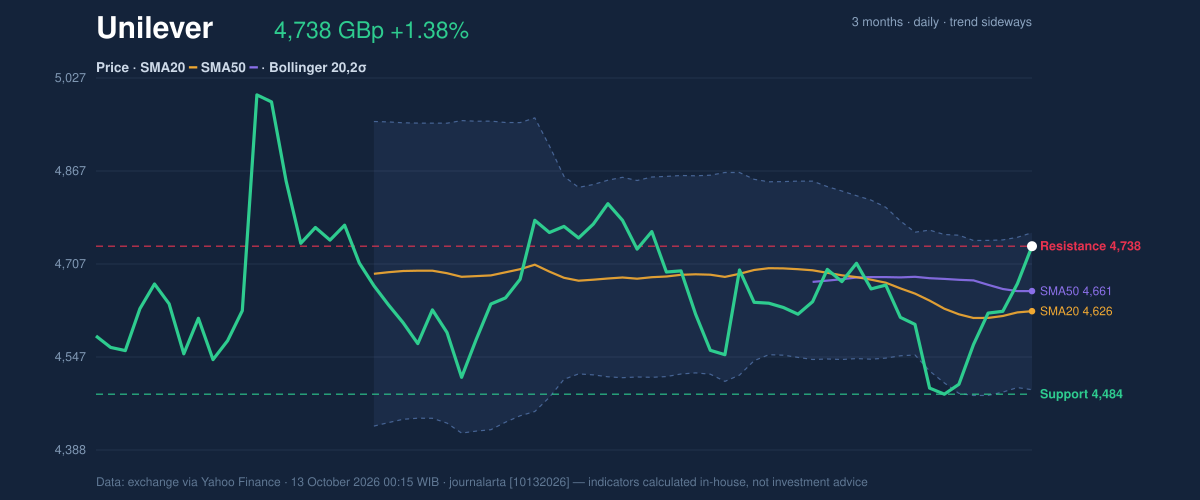
Oscillators & Momentum
Momentum indicators are mixed. The RSI, a measure of the pace of recent gains and losses, stands at 59.7, a neutral reading; it does not yet show the extreme conditions that often accompany an overstretched move. The Stochastic indicator, which compares the latest close with the recent trading range, tells a different story: %K is 99.8 and %D is 77.2, putting it in overbought territory. The MACD has a negative reading of -6.844, but it is above its signal line at -20.515, producing a positive histogram of 13.671. This points to improving momentum, not necessarily a fully established advance. In plain terms, buyers appear to have gained short-term force, while the Stochastic warns that the rise may be due a pause.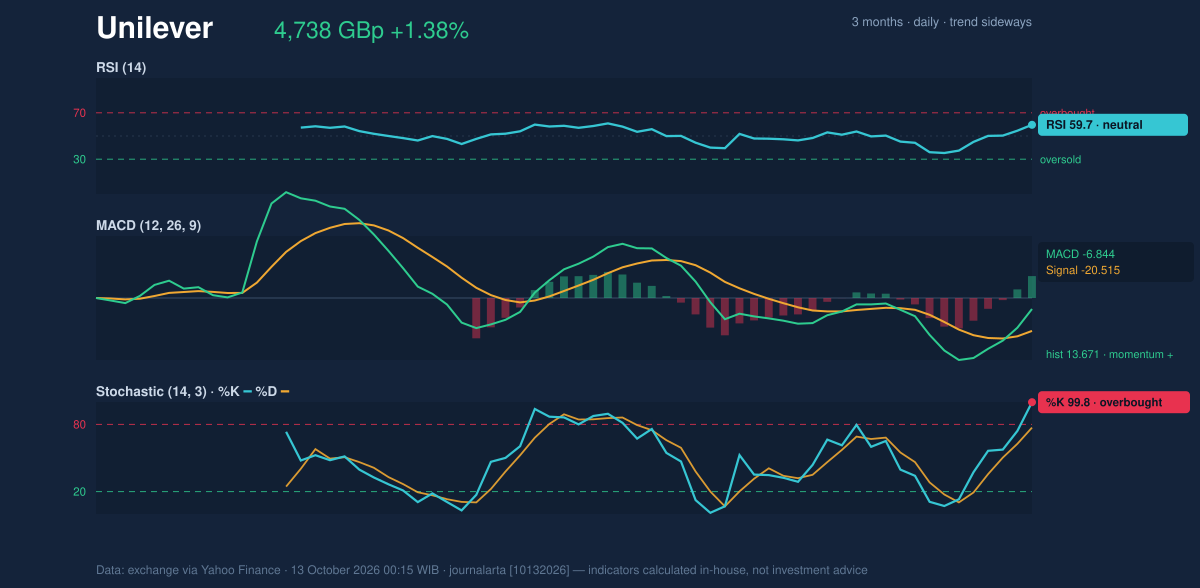
Volatility & Volume
The Bollinger bands are narrowing, with a 5.8% width, a pattern often associated with a period of relatively compressed price movement that can precede a larger move. The price’s 91% position within the bands places it close to the upper boundary at 4,761.08 GBp; the middle band is 4,626.15 GBp and the lower band is 4,491.22 GBp. A squeeze signals that volatility has contracted, but does not indicate which direction a break will take. The latest reported volume is 15 against a 20-day average of 3,219,197, recorded as effectively 0.0 times average, while on-balance volume (OBV)—a running measure that uses trading volume to gauge buying or selling pressure—is falling. That makes the price rise less convincing as evidence of broad participation. The reported ATR, a measure of typical price movement, is 407.80 GBp, or 8.6% of the share price, indicating high volatility. The combination calls for caution in reading a single session’s move, particularly given the very thin volume figure.Key Levels & Scenarios
The immediate reference is resistance at 4,738.00 GBp, the same level as the latest close. A sustained move above it would clear the stated 20-day ceiling; failure to hold near that level could leave the price testing support at 4,483.50 GBp. The 20-day SMA at 4,626.15 GBp offers an intermediate reference, while the lower Bollinger band at 4,491.22 GBp sits close to support. The supplied three-month high is 5,041.00 GBp, but the listed low is 0.00 GBp and is not a useful price reference for assessing the trading range. With no confirmed moving-average crossover and volume failing to confirm the advance, the near-term evidence is better described as a test of resistance than a settled breakout.Technical Verdict: HOLD
HOLD (wait & see) fits the mixed signals: the MACD histogram is positive and the price is above the 20-day SMA, but the Stochastic is overbought, OBV is falling and reported volume is exceptionally thin. The narrowing Bollinger bands show that a larger move may be developing, not that its direction is settled. - Ideal entry range: 4,626.15–4,738.00 GBp, bounded by the 20-day SMA and current resistance. - Exit target: 4,761.08 GBp, the upper Bollinger band. - Stop-loss protection: 4,483.50 GBp, the stated 20-day support. - Invalidation condition: the verdict is invalidated if the price falls below 4,483.50 GBp. For non-traders, the indicators show improving momentum, but not enough confirmation to establish that the share price has broken out of its sideways pattern.| Measure | Reading |
|---|---|
| Last price | 4,738.00 GBp |
| Daily change | +1.38% |
| SMA20 / SMA50 | 4,626.15 / 4,660.73 GBp |
| RSI(14) | 59.7 (neutral) |
| Stochastic %K / %D | 99.8 / 77.2 (overbought) |
| MACD / signal / histogram | -6.844 / -20.515 / 13.671 |
| Bollinger bands | 4,491.22 / 4,626.15 / 4,761.08 GBp |
| 20-day support / resistance | 4,483.50 / 4,738.00 GBp |
| Volume / 20-day average | 15 / 3,219,197 |
Summary Data Unilever
| Last price | 4,738.00 GBp |
| Change 1 day / 5 days / 1 month | 1.38% / 5.28% / 0.87% |
| Trend / MA-cross | sideways / none |
| SMA20 / SMA50 | 4,626.15 / 4,660.73 |
| RSI (14) / Stochastic %K | 59.7 / 99.8 |
| Bollinger %B / ATR | 91% / 407.80 |
| Support / Resistance 20 days | 4,483.50 / 4,738.00 |
| Data as of | 13 October 2026 00:15 WIB |
Disclaimer: This technical analysis is generated automatically from exchange data (via Yahoo Finance) and indicators calculated by JournalArta, for information and education only. The verdict and the entry, target and stop-loss levels are not investment advice or a solicitation to buy or sell any security. Investment decisions and their risks rest solely with the reader.
Track Unilever share price daily: live levels, support/resistance and our full Unilever analysis history.