Wilmar Stock Week Ahead (November 9–13): What Comes After a 1.33% Weekly Loss
Wilmar stock week ahead for November 9–13: last close 2.97 SGD, weekly change -1.33%, support 2.95, resistance 3.51.

Wilmar International enters the November 9–13 trading week at S$2.97, below its key moving averages and close to a recent support zone, after a volatile week in which heavy turnover accompanied a modest decline.
Last Week in Review
The stock fell 1.33% over the week ended November 6, closing at S$2.97 versus S$3.01 on October 30. It opened the week at S$2.99 and traded between S$2.91 and S$3.03; both extremes came on November 3. The close sat at the midpoint of that weekly range.
November 5 was the strongest session, gaining 1.69%, while November 2 was the weakest, down 1.99%. Wilmar rose in two sessions and fell in three. Average daily volume reached 13,277,100 shares, or 2.34 times the average for the preceding 20 sessions—a notably busy week for a stock that still ended lower.
Technical Map for the Week Ahead
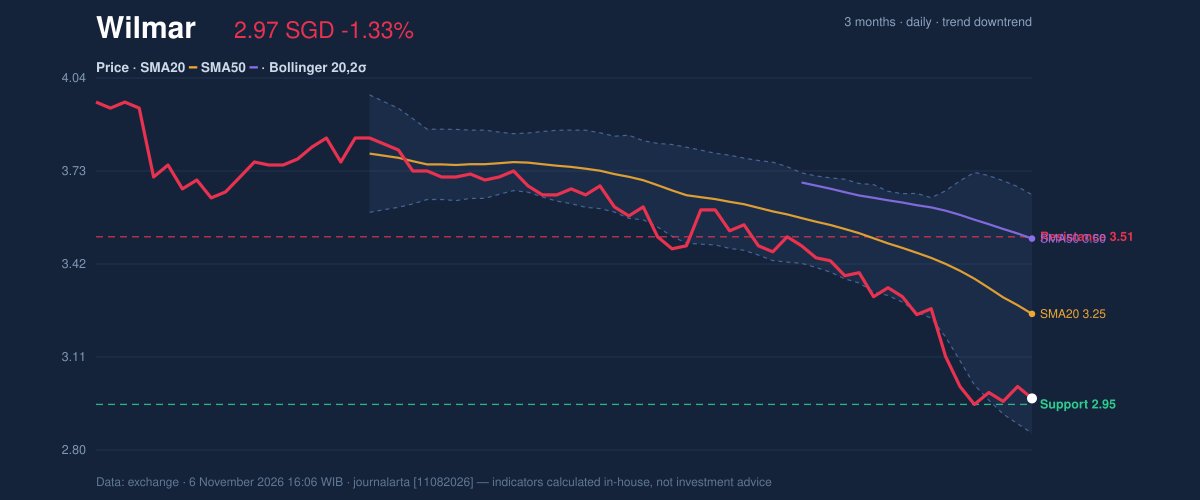
The short-term structure remains weak. Wilmar is in a downtrend, with its 20-day moving average falling at a slope of 4.24% over five days. The share price is below both the SMA20 at S$3.25 and the SMA50 at S$3.50, with no new moving-average crossover. The nearest 20-day support is S$2.95; resistance is S$3.51. Over three months, the range is S$2.91 to S$3.99.
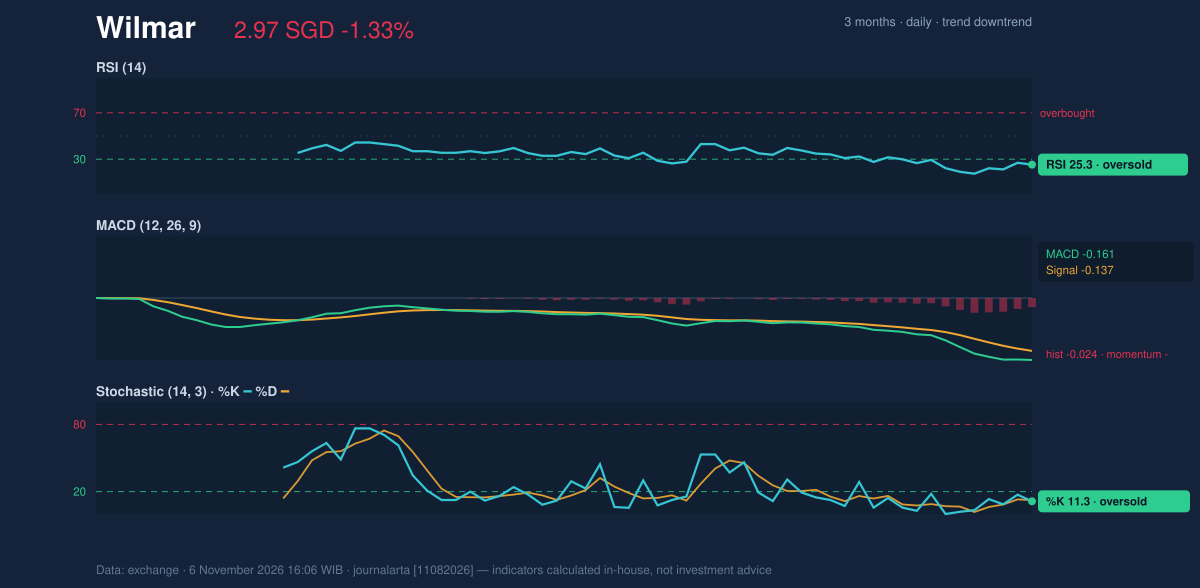
The chart shows how price is pressing the lower part of its recent range, while the momentum panel captures a market that is oversold but not yet showing a confirmed reversal.
RSI(14) is 25.3, and the stochastic readings—%K at 11.3 and %D at 12.4—are also in oversold territory. That can signal that selling has been intense, but it does not by itself establish that the decline has ended. MACD is negative at -0.161 against a signal of -0.137, with a -0.024 histogram, indicating negative momentum. The Bollinger bands are widening, a sign of elevated volatility: the lower band is S$2.85, the middle band S$3.25 and the upper band S$3.65. The stock’s %B reading is 15%.
Bullish scenario: a move above S$3.10—the reference level at 1.5 times ATR above the current price—would be an initial sign of recovery. The more consequential test is the S$3.25 SMA20; a sustained break above it would challenge the prevailing short-term weakness, with S$3.51 the next major 20-day resistance.
Bearish scenario: a break below S$2.95 would put the 20-day support at risk, bringing the three-month low of S$2.91 into focus. The lower Bollinger band at S$2.85 is another reference if selling extends.
Fundamentals and Catalysts
Wilmar is a Singapore-headquartered agribusiness group that processes, brands and distributes everyday food products. Its Food Products arm has significant exposure to edible oils and packaged foods, linking the company to high-volume consumer staples, according to information published on October 28. That business profile can provide context for how investors assess the shares, but the available company information does not establish a near-term earnings or trading catalyst for the coming week.
The company operates across Singapore, China, Indonesia, Malaysia, Australia, Europe, South Africa, Nigeria, Vietnam, India and other international markets, according to an overview published on November 4. That geographic breadth makes Wilmar an internationally exposed business rather than a single-market food producer.
Also reported on November 4, independent director George Yeo bought 100,000 Wilmar shares at S$2.97 each on November 4, increasing his stake. The reported transaction is a company-specific data point, though it does not alter the technical thresholds that traders will be watching.
Macro, Political and Global Factors
The available research contains no dated macroeconomic or global-market data relevant to the November 9–13 week. It does, however, record a policy-related issue: Wilmar was among ten companies asked by the Singapore government to deal with recurring trans-boundary haze, reported on November 4. The matter places environmental and regulatory attention on the company, although the research provides no further detail on deadlines, enforcement or financial impact.
Risks and What Would Invalidate the Scenario
The clearest near-term technical risk is a failure of support at S$2.95. A move below it would weaken the case that the current oversold readings are forming a base; S$2.91, the three-month low, is the next key reference. Conversely, a recovery that cannot clear S$3.25 would leave the price below its SMA20, while S$3.51 remains the 20-day resistance barrier.
Volume also deserves attention: the week’s average turnover was 2.34 times the preceding 20-session average, and the latest session’s volume was 2.3 times its 20-day average, while on-balance volume was falling. That combination underscores the risk that active trading may accompany continued distribution rather than a durable rebound. The widening Bollinger bands point to elevated volatility, so oversold momentum readings are not a standalone signal of a trend change.
Technical Verdict for the Week: HOLD
The technical bias is neutral, supporting a wait-and-see stance rather than a directional call. The strongest reasons are the oversold RSI at 25.3, the price below the SMA20 at S$3.25 and SMA50 at S$3.50, and negative MACD momentum at -0.161 with a -0.024 histogram. Falling on-balance volume adds caution. The verdict is invalidated on the downside if price breaks below S$2.95 support.
- Entry range: S$2.95–S$3.10, spanning 20-day support and the 1.5×ATR upper reference.
- Target reference: S$3.51, the 20-day resistance.
- Stop reference: S$2.84, the price minus 1.5×ATR level.
In plain English, the chart is stretched to the downside, but the trend has not yet turned upward.
Wilmar Week Ahead Data
| Trading week | November 2 – November 6 (5 sessions) |
| Weekly change | -1.33% (3.01 → 2.97 SGD) |
| Week high / low | 3.03 (November 3) / 2.91 (November 3) |
| Best / worst session | 1.69% (November 5) / -1.99% (November 2) |
| Avg daily volume vs prior 20 sessions | 13,277,100 vs 5,675,925 (2.34x) |
| SMA20 / SMA50 | 3.25 / 3.50 |
| RSI (14) / Stochastic %K | 25.3 / 11.3 |
| Support / Resistance 20 days | 2.95 / 3.51 |
| 3-month high / low | 3.99 / 2.91 |
| Week covered | November 9–13, 2026 |
| Data as of | 6 November 2026 16:06 WIB |
Disclaimer: This technical analysis is generated automatically from exchange data and indicators calculated by JournalArta, for information and education only. The verdict and the entry, target and stop-loss levels are not investment advice or a solicitation to buy or sell any security. Investment decisions and their risks rest solely with the reader.
Track Wilmar share price daily: live levels, support/resistance and our full Wilmar analysis history.