ST Engineering Stock Week Ahead: Technical Outlook for November 9–13
ST Engineering stock week ahead for November 9–13: last close 9.26 SGD, weekly change -8.77%, support 9.26, resistance 10.41.

ST Engineering shares fell 8.77% in the week to November 6, closing at S$9.26 after touching a weekly low of S$9.01. The close was near the bottom of the week’s range, while heavier-than-usual trading accompanied the decline, leaving the stock under pressure heading into the November 9–13 trading week.
Last Week in Review
The Singapore-listed stock opened the week at S$10.15 and reached its weekly high of S$10.15 on November 2, according to the supplied exchange data. It ended November 6 at S$9.26, down exactly 8.77% for the week; the final session alone saw a 5.51% drop. The weekly low was S$9.01, also recorded on November 6.
Only one session advanced, with the best performance a 0.51% rise on November 4. Four sessions fell, and November 6 was the worst. The close sat in the lower portion of the weekly range, consistent with sellers retaining control into the weekend.
Average daily volume reached 6,760,140 shares, compared with 4,305,557 over the preceding 20 sessions, or 1.57 times that benchmark. On November 6, volume was 11,917,000 shares—2.8 times the 20-session average in the market data—while On-Balance Volume (OBV), a measure that tracks buying and selling pressure through volume, was declining.
Technical Map for the Week Ahead
The chart structure is weak: the S$9.26 close is below both the S$10.14 20-day moving average and the S$10.41 50-day average. The 20-day average is falling at 2.64% over five days, reinforcing the downtrend rather than signalling a turn.
S$9.26 is the stated 20-day support, while S$10.41 is the 20-day resistance. The three-month range runs from S$9.01 to S$11.29. The lower Bollinger Band—an indicator that frames price movement around a moving average—stands at S$9.59, above the close; the stock’s reading below that band points to unusually weak recent price action. The band width is 11.0%, classified as normal.
The momentum gauges are stretched but still negative. RSI, which measures the pace of recent gains and losses, is 19.0, in oversold territory; stochastic readings of 16.8 and 19.3 are also oversold. These conditions can accompany a rebound, but they do not by themselves establish one. MACD is -0.235 against a -0.159 signal line, with a -0.076 histogram, indicating negative momentum.
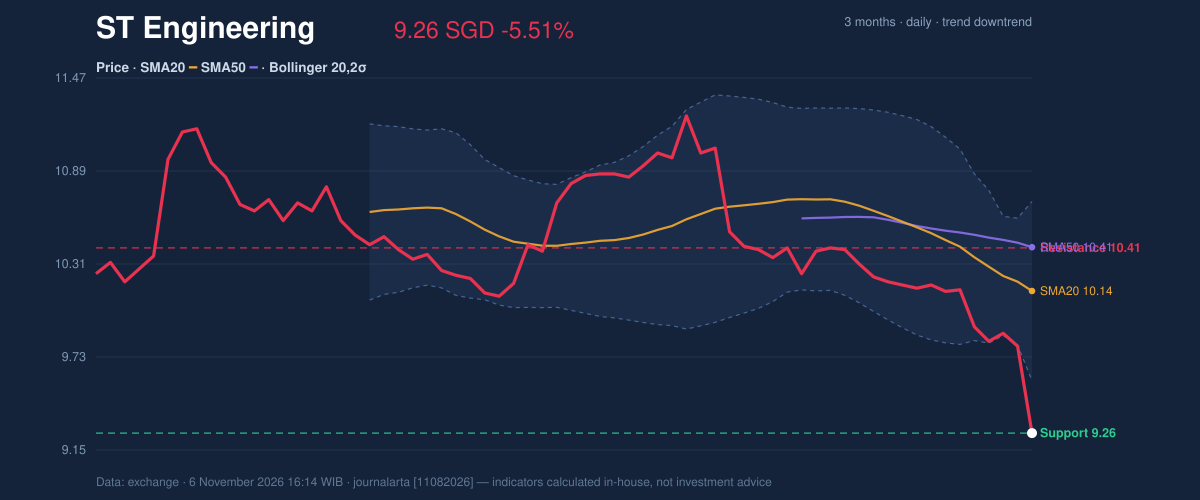
The price chart shows the key near-term test: whether S$9.26 holds, or price instead revisits the S$9.01 three-month low. A close below the lower Bollinger Band and falling OBV add caution; neither indicator yet shows a confirmed reversal.
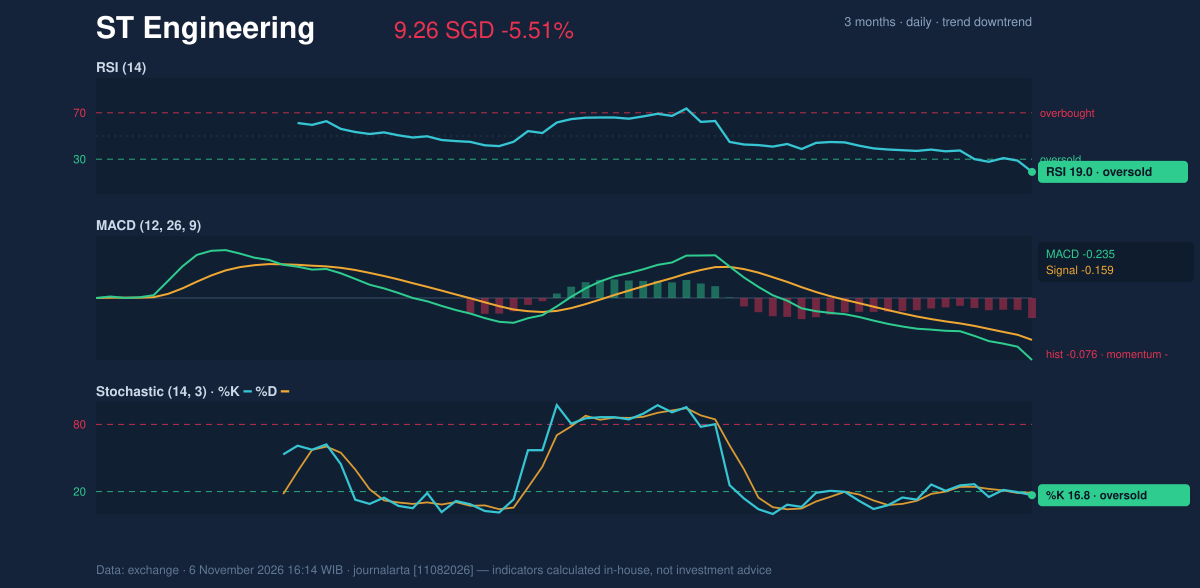
Bullish scenario: A move above S$9.65, the supplied price-plus-1.5-ATR reference, would be an initial sign of a rebound; reclaiming S$10.14 would be a stronger improvement, bringing the price back above the 20-day average. RSI’s oversold reading provides room for a bounce, but momentum would need to improve to support that case.
Bearish scenario: A break below S$9.26 would put the three-month low at S$9.01 in focus. If that level also gives way, the supplied price-minus-1.5-ATR reference is S$8.87. ATR, or Average True Range, estimates typical price movement; its current reading is S$0.26, equivalent to 2.8% of the share price.
Risks and What Would Invalidate the Scenario
The main risk to the bearish reading is a sustained recovery above S$10.41, the 20-day resistance and 50-day average. A move back above S$10.14 would also weaken the near-term downtrend signal, though it would not by itself clear that higher resistance. Oversold RSI and stochastic readings raise the possibility of a sharp bounce, especially after the high-volume decline.
For the bearish scenario, a break above S$10.41 would invalidate the immediate downside setup. On the other side, a close below S$9.26 would confirm a loss of the stated 20-day support; a fall through S$9.01 would extend the decline beyond the three-month low. The technical bias remains bearish: the supplied assessment records three bearish signals and no bullish signals.
Technical Verdict for the Week: SELL
SELL is the technical verdict, matching the supplied bearish bias. The strongest signals are the close below the falling 20-day average at S$10.14; negative MACD, with its histogram at -0.076; and declining OBV alongside the high-volume sell-off. RSI at 19.0 is a counterweight because oversold conditions can precede a rebound, but it is not yet confirmation of one.
- Entry range: S$9.01–S$9.26, bounded by the three-month low and 20-day support.
- Target price: S$9.01, the three-month low.
- Stop loss: S$10.41, above the 20-day resistance.
The verdict is invalidated if the price breaks above S$10.41. In plain English, the chart remains tilted downward unless the share price recovers above that resistance.
ST Engineering Week Ahead Data
| Trading week | November 2 – November 6 (5 sessions) |
| Weekly change | -8.77% (10.15 → 9.26 SGD) |
| Week high / low | 10.15 (November 2) / 9.01 (November 6) |
| Best / worst session | 0.51% (November 4) / -5.51% (November 6) |
| Avg daily volume vs prior 20 sessions | 6,760,140 vs 4,305,557 (1.57x) |
| SMA20 / SMA50 | 10.14 / 10.41 |
| RSI (14) / Stochastic %K | 19.0 / 16.8 |
| Support / Resistance 20 days | 9.26 / 10.41 |
| 3-month high / low | 11.29 / 9.01 |
| Week covered | November 9–13, 2026 |
| Data as of | 6 November 2026 16:14 WIB |
Disclaimer: This technical analysis is generated automatically from exchange data and indicators calculated by JournalArta, for information and education only. The verdict and the entry, target and stop-loss levels are not investment advice or a solicitation to buy or sell any security. Investment decisions and their risks rest solely with the reader.
Track ST Engineering share price daily: live levels, support/resistance and our full ST Engineering analysis history.