UOB Stock Gains 2.21%, RSI Overbought In Focus
Technical analysis of UOB stock on Juli 16, 2026: price 44.95 SGD, trend uptrend, RSI 82.5, support 39.25, resistance 44.38. Key angle: UOB Stock Gains.

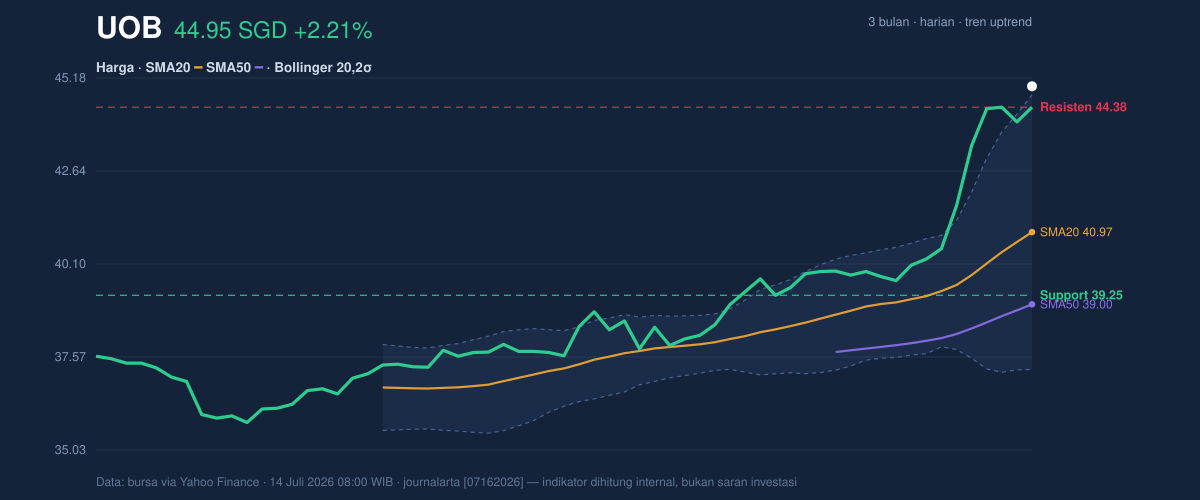
United Overseas Bank (UOB) shares surged on the Singapore Exchange as investors recalibrated their positions in the banking sector, pushing the stock to 44.95 SGD during the latest session. This move represents a significant 2.21% gain in a single day, cementing a broader rally that has seen the stock climb 15.26% over the past month. As the bank trades well above its SMA20 of 40.97 and SMA50 of 39.00, the technical structure reflects a robust, momentum-driven uptrend that has effectively distanced the share price from its three-month low of 35.70 SGD.
Trend and Price Action
The bank’s current price structure is characterized by aggressive accumulation. With the SMA20 slope rising at 3.65% over five days, the velocity of the move is accelerating, suggesting that institutional interest has intensified. The stock has broken through its established resistance at 44.38 SGD, a development that forces a reassessment of valuation boundaries. However, the price currently sits at 111% of the recent 20-day trading range, indicating that UOB is pushing into uncharted territory.
Momentum and Exhaustion
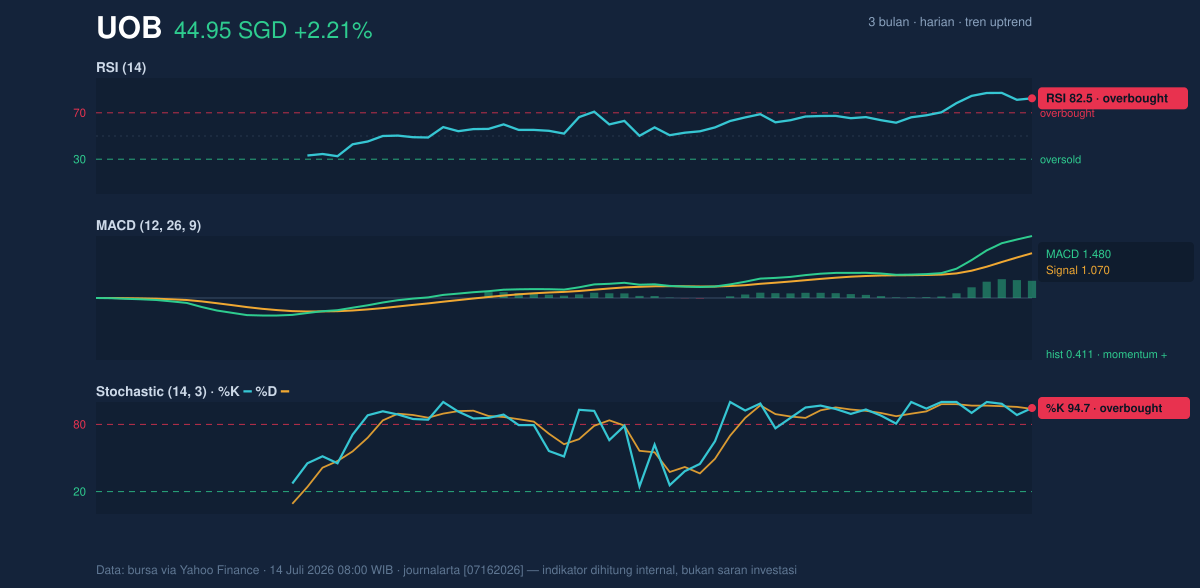
While the trend remains definitively bullish, the underlying momentum indicators suggest the market may be grappling with an extension of gains. The RSI(14) at 82.5 signals an overbought condition, often serving as a precursor to a period of consolidation or a technical pullback. This is mirrored by the Stochastic oscillator, where %K at 94.7 and %D at 93.8 confirm that the stock has been moving rapidly into extreme territory. Despite these signs of overheating, the MACD at 1.480 remains above its signal line at 1.070, with a positive histogram of 0.411, indicating that buyers still control the narrative.
Volatility and Volume Participation
The expansion in market participation is evident in the volume data. UOB recorded a volume of 3,578,000 shares, which stands at 1.1x the 20-day moving average. The rise in On-Balance Volume (OBV) provides a crucial layer of confirmation, suggesting that the recent price appreciation is backed by genuine inflows rather than speculative retail froth. Bollinger Band analysis adds a layer of caution; the %B indicator is at 103%, meaning the price has pushed beyond the upper band at 44.72 SGD. In standard technical theory, this stretch often precedes a mean-reversion phase where the price consolidates toward the median SMA20 value.
Technical Verdict: HOLD (wait & see)
The verdict of HOLD (wait & see) is derived from the collision between strong institutional momentum and extreme short-term exhaustion.
* Overbought RSI/Stochastic: Current levels are unsustainable for a long-duration move without a rest period.
* Bollinger Expansion: Trading at 103% of the bands suggests the stock is currently "expensive" in the very short term.
* Verdict invalidated: If the price sustains a breakout above the current daily high with a significant surge in volume, the momentum may override the exhaustion signals.
Ideal Positioning Framework:
* Entry Range: Consider waiting for a retest of the 44.38 SGD level, which should now act as structural support.
* Exit Target: Historical resistance suggests the next psychological ceiling lies in the 46.00 SGD area.
* Stop Loss: Protection should be placed below the 40.97 SGD level, corresponding to the current SMA20 value.
The bank is scheduled to provide further updates on its capital allocation strategy during the upcoming quarterly financial disclosure session.
Summary Data UOB
| Last price | 44.95 SGD |
| Change 1 day / 5 days / 1 month | 2.21% / 7.82% / 15.26% |
| Trend / MA-cross | uptrend / none |
| SMA20 / SMA50 | 40.97 / 39.00 |
| RSI (14) / Stochastic %K | 82.5 / 94.7 |
| Bollinger %B / ATR | 103% / 0.77 |
| Support / Resistance 20 days | 39.25 / 44.38 |
| Data as of | 14 Juli 2026 08:00 WIB |



