Tencent Stock Gains 3.58%, Testing Key Resistance In Focus
Technical analysis of Tencent stock on Juli 16, 2026: price 474.00 HKD, trend sideways, RSI 52.9, support 411.80, resistance 478.80. Key angle: Tencent Stock…

Tencent Holdings (0700.HK) surged 3.58% to close at 474.00 HKD in the latest session, signaling a decisive move toward the upper bounds of its recent trading range. The rally, which significantly outpaced the stock's five-day performance of 2.78%, highlights renewed buying interest as the stock shakes off a period of consolidation. By reclaiming territory comfortably above both its SMA20 at 442.47 and SMA50 at 450.55, Tencent has shifted its short-term posture from lethargic sideways movement to a posture of active re-engagement with its 20-day resistance.
Price Structure and Volatility
The current price action places Tencent at approximately 92% of its recent trading range, just shy of the resistance level of 478.80 HKD. This positioning is reinforced by the Bollinger Bands, where the stock is currently at a %B of 92%, suggesting that prices are pressing hard against the upper threshold of 479.68 HKD. While the band width remains at a stable 16.8%, the ATR of 18.50 indicates that market participants should remain prepared for heightened price swings, as the stock moves with a volatility profile roughly 3.9% of its current value.
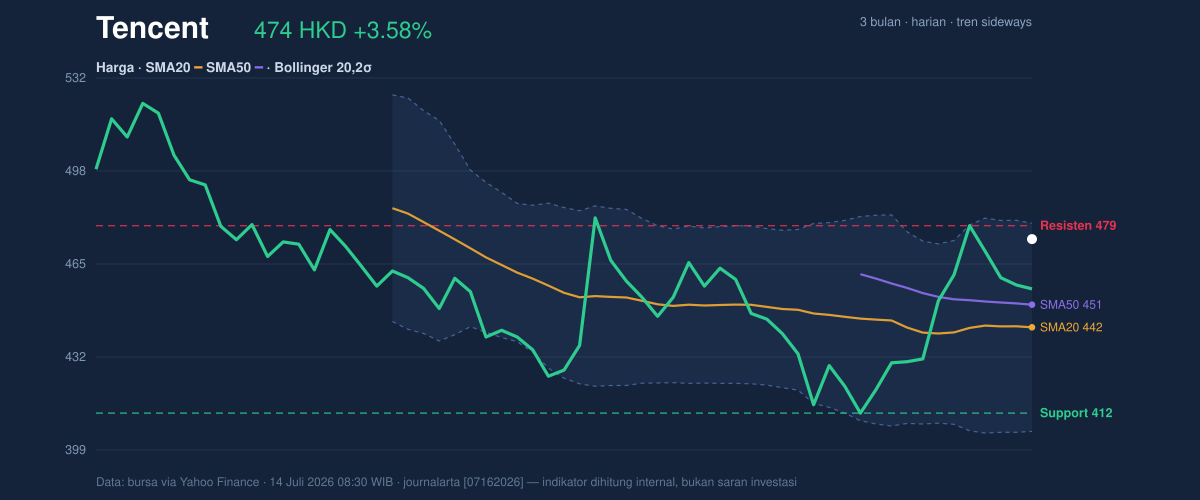
The absence of a fresh MA-cross means the broader trend lacks a major directional anchor, yet the slope of the SMA20 at 0.41% over five days confirms a gentle, positive bias. The critical hurdle remains the 478.80 HKD resistance; failing to clear this barrier could invite a drift back toward the 442.47 HKD midline.
Momentum and Market Participation
Tencent’s momentum indicators offer a nuanced view of this rally. The RSI at 52.9 sits firmly in neutral territory, suggesting that despite the recent jump, the stock is not yet overextended. Similarly, the Stochastic %K of 61.1 and %D of 63.5 align with this neutral stance, providing a balanced outlook that supports the potential for further gains without immediate risk of a technical pullback.
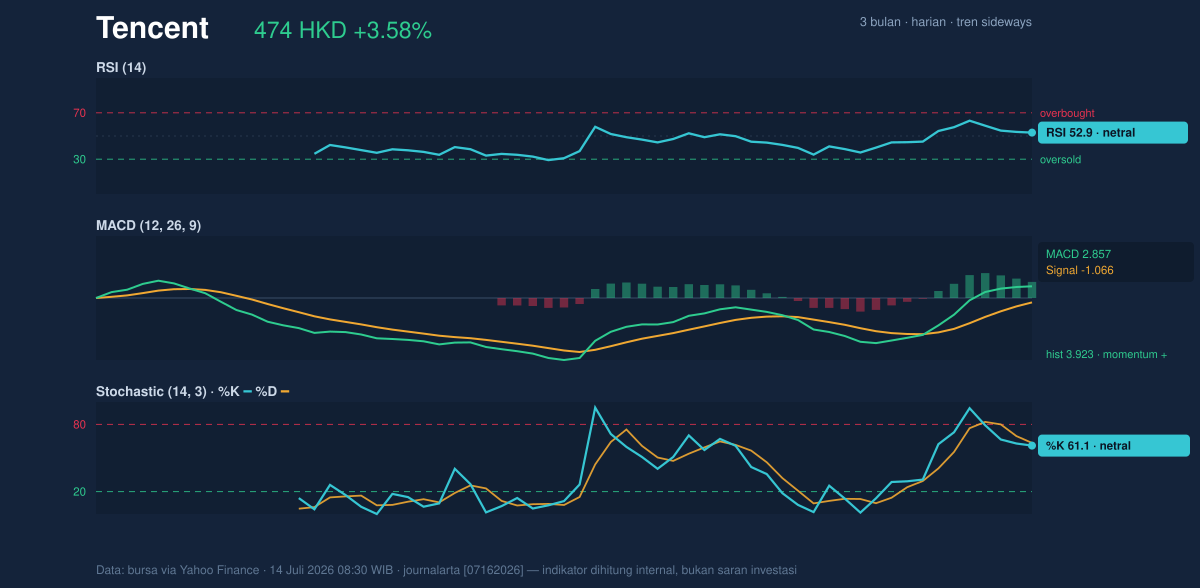
The MACD reading of 2.857 remains above its signal line of -1.066, with a positive histogram of 3.923, confirming that underlying momentum is leaning bullish. However, this move has occurred on relatively muted volume—approximately 25.5 million shares against a 34.5 million 20-day average. While the OBV (On-Balance Volume) is trending upward, the lack of significant volume suggests that this breakout attempt is currently being driven by a reduction in selling pressure rather than an explosive surge in aggressive institutional buying.
Technical Verdict: HOLD (Wait & See)
The current technical state suggests a cautious wait-and-see approach as the stock tests significant overhead resistance.
* Rationale: The price is constrained by the 478.80 HKD resistance, and the low relative volume indicates that the recent 3.58% move lacks the participation density to guarantee a clean breakout.
* Invalidation: The neutral outlook is invalidated if the price clears the 478.80 HKD level with high volume, or if it falls back below the 442.47 HKD SMA20 support.
* Entry Range: 445.00 – 455.00 HKD (on consolidation).
* Exit Target: 478.80 HKD (initial) / 526.50 HKD (3-month high).
* Stop Loss: 411.80 HKD (20-day support).
The market is effectively waiting to see if Tencent has the conviction to break through its near-term ceiling, or if the current momentum will stall against established resistance.
"We are seeing a constructive move, but until the resistance holds or breaks on conviction volume, the risk-to-reward ratio remains in a state of flux," a market participant noted regarding the current price action.
Summary Data Tencent
| Last price | 474.00 HKD |
| Change 1 day / 5 days / 1 month | 3.58% / 2.78% / 2.24% |
| Trend / MA-cross | sideways / none |
| SMA20 / SMA50 | 442.47 / 450.55 |
| RSI (14) / Stochastic %K | 52.9 / 61.1 |
| Bollinger %B / ATR | 92% / 18.50 |
| Support / Resistance 20 days | 411.80 / 478.80 |
| Data as of | 14 Juli 2026 08:30 WIB |


