Singtel Testing Key Resistance: Stock Drops 0.45% (Juli 16, 2026)
Technical analysis of Singtel stock on Juli 16, 2026: price 4.41 SGD, trend sideways, RSI 52.0, support 4.33, resistance 4.47. Key angle: Singtel Testing Key…

Singapore Telecom (Singtel) shares closed at 4.41 SGD on the Singapore Exchange (SGX) as of mid-July 2026, navigating a period of narrow consolidation that reflects a cautious tug-of-war between regional growth aspirations and domestic market saturation. While the stock sits roughly 12% off its three-month high of 5.05 SGD, the current price action reveals a transition from a recent downtrend toward a period of potential stabilization. The broader telecommunications landscape remains sensitive to capital expenditure requirements, yet market participants are currently focusing on the firm’s ability to defend its yield and core margins within a stable interest-rate environment.
Trend and Price Structure
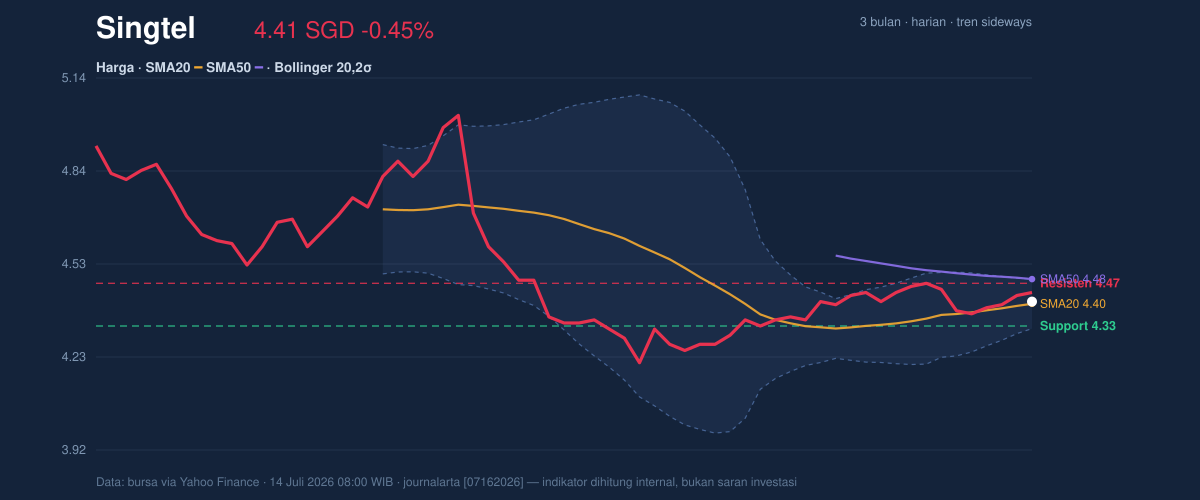
Singtel currently trades at 4.41 SGD, placing it slightly above its 20-day Simple Moving Average (SMA20: 4.40 SGD). This positioning is significant as it suggests a tentative shift in sentiment; however, the stock remains tethered below the SMA50 at 4.48 SGD. The lack of a definitive MA-cross—either golden or death—indicates that the stock is currently lacking a long-term directional mandate. The 5-day slope of the SMA20 is positive at 0.77%, highlighting a gradual improvement in short-term momentum.
Volatility and Volume Dynamics
A critical technical feature currently observed in Singtel’s price action is the Bollinger Band squeeze, as evidenced by a band width of only 3.7%. With the price at 54% of the Bollinger range and a %B value of 54%, the market is effectively waiting for a catalyst to break the 4.32–4.48 SGD corridor. Of particular interest is the trading volume, which recently hit 33,097,800 shares. This represents 1.2x the 20-day average volume, suggesting that institutional participants are accumulating or shifting positions ahead of a potential breakout. The fact that the OBV (On-Balance Volume) is rising despite the minor 0.45% daily dip confirms that the underlying participation favors a more aggressive accumulation phase than the static price suggests.
Momentum and Oscillators
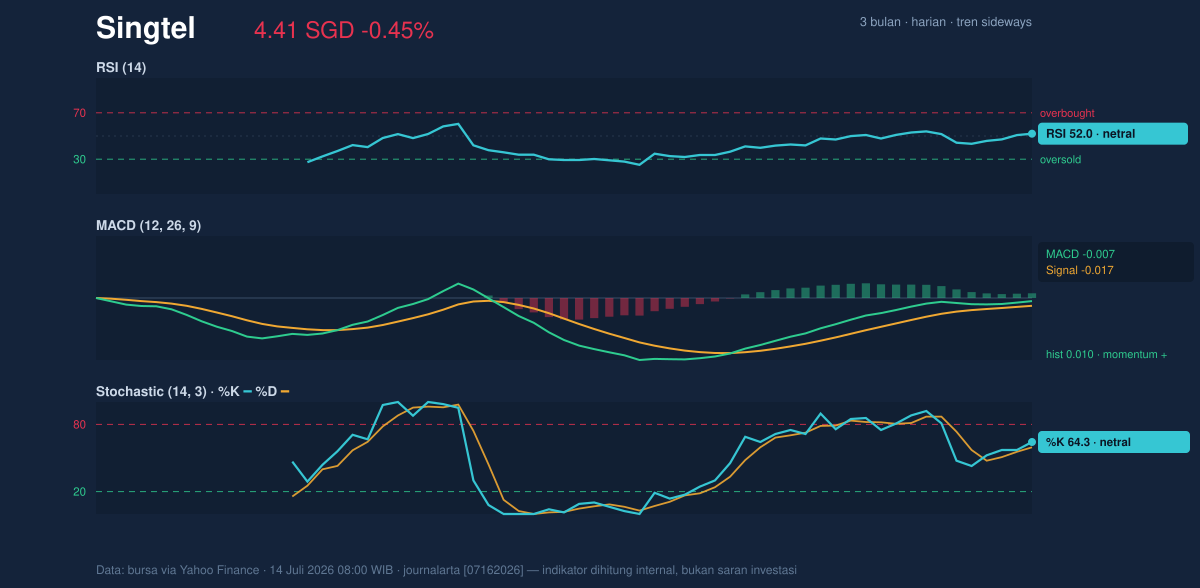
Momentum indicators provide a nuanced picture of the stock's health. The RSI at 52.0 sits squarely in neutral territory, avoiding the overbought dangers often associated with rapid rallies while signaling enough strength to avoid a bearish collapse. The MACD histogram is at 0.010, confirming that short-term momentum is positive, as the MACD line remains above the signal line. Complementing this, the Stochastic %K of 64.3 suggests that the stock has room to move higher before encountering overbought conditions.
Key Levels & Scenarios
The immediate technical barrier rests at 4.47 SGD, which aligns with both the recent 20-day resistance and the SMA50. If buyers can push the stock through this ceiling with sustained volume, the path opens toward the upper band. Conversely, should the price fail to hold the SMA20 support at 4.40 SGD, the stock is likely to revert toward the 4.33 SGD support level, which coincides with the 20-day lower range boundaries. Given an ATR(14) of 0.07, or 1.6% of the current price, traders are anticipating a moderate swing potential of approximately 0.07 SGD in either direction over the coming sessions.
Technical Verdict: HOLD (wait & see)
The current technical setup suggests a patient approach until a clear breakout occurs from the tight Bollinger compression.
* Reasons: The stock is trapped between the SMA20 and SMA50; the neutral RSI signals a lack of decisive trend strength; the current volume spike is encouraging but requires confirmation of a break above resistance.
* Invalidation: The neutral outlook is invalidated if the price drops below 4.32 SGD, which would signal a breakdown of the current consolidation floor.
Ideal Parameters:
* Entry Range: Accumulation bias only upon a confirmed breakout above 4.48 SGD.
* Exit Target: 4.70 SGD (near-term psychological resistance).
* Stop Loss: 4.32 SGD (below the Bollinger lower band).
The stock is currently transitioning through a low-volatility period where the next directional move will likely be dictated by a surge in volume breaking the existing narrow trading range.
Summary Data Singtel
| Last price | 4.41 SGD |
| Change 1 day / 5 days / 1 month | -0.45% / 0.68% / 2.56% |
| Trend / MA-cross | sideways / none |
| SMA20 / SMA50 | 4.40 / 4.48 |
| RSI (14) / Stochastic %K | 52.0 / 64.3 |
| Bollinger %B / ATR | 54% / 0.07 |
| Support / Resistance 20 days | 4.33 / 4.47 |
| Data as of | 14 Juli 2026 08:00 WIB |



