HSBC Stock Gains 0.98% Today, Testing Key Resistance
Technical analysis of HSBC stock on Juli 16, 2026: price 155.30 HKD, trend uptrend, RSI 62.0, support 145.80, resistance 153.80. Key angle: HSBC Stock Gains.

HSBC Holdings (0005.HK) opened the session with a persistent climb, trading at 155.30 HKD as of mid-July, a move that reinforces its position atop the local banking sector’s performance board. The 0.98% daily gain reflects a broader 8.75% rally over the past month, signaling that market participants are increasingly comfortable with the bank’s current valuation despite a cooling pace in transaction volumes. The stock is currently navigating a period of technical expansion, testing the upper boundaries of its established trading range.
Trend & Price Action
The equity is exhibiting a robust bullish structure, supported by a healthy slope in its short-term moving average. With a SMA20 at 149.80 HKD and a SMA50 at 145.07 HKD, the stock maintains a clean gap between its moving averages, confirming that the medium-term uptrend remains intact. The current price is situated comfortably above both markers, which typically signals that the path of least resistance remains upward for buyers.
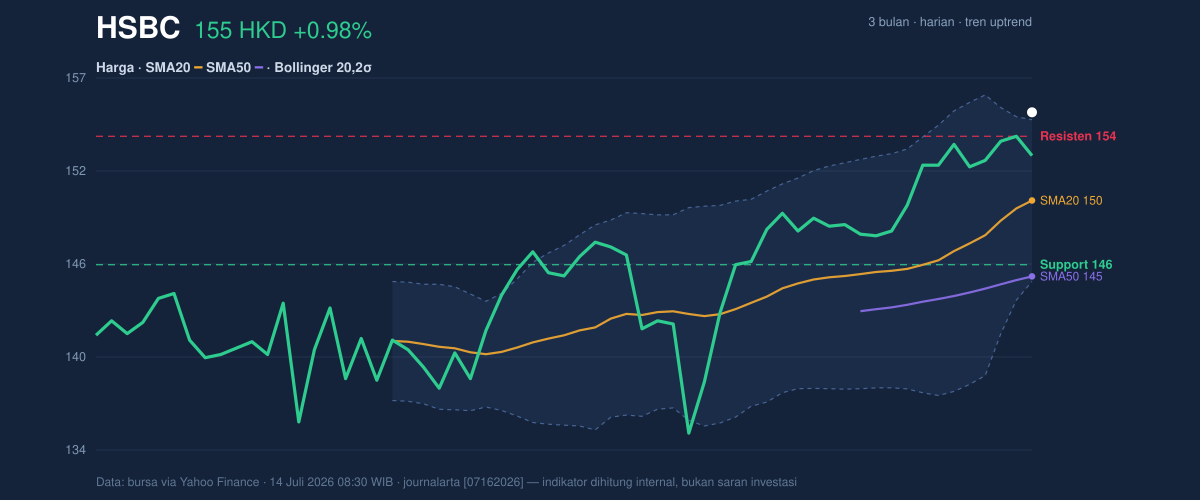
Price action is currently challenging the structural ceiling of the last 20 sessions. Having eclipsed the previous resistance at 153.80 HKD, the stock is now testing new territory. The Bollinger %B at 105% indicates that the price has pushed slightly outside the upper band, a condition often associated with aggressive momentum, though it necessitates caution regarding potential short-term pullbacks toward the 149.80 HKD mean.
Oscillators & Momentum
Momentum indicators suggest a market in a state of controlled acceleration. The RSI(14) at 62.0 sits in the neutral-to-bullish zone, providing enough room for further upside before entering overbought territory. Meanwhile, the MACD reading of 2.428 remains above the signal line of 2.191, with a positive histogram confirming that institutional accumulation is keeping the trend afloat.
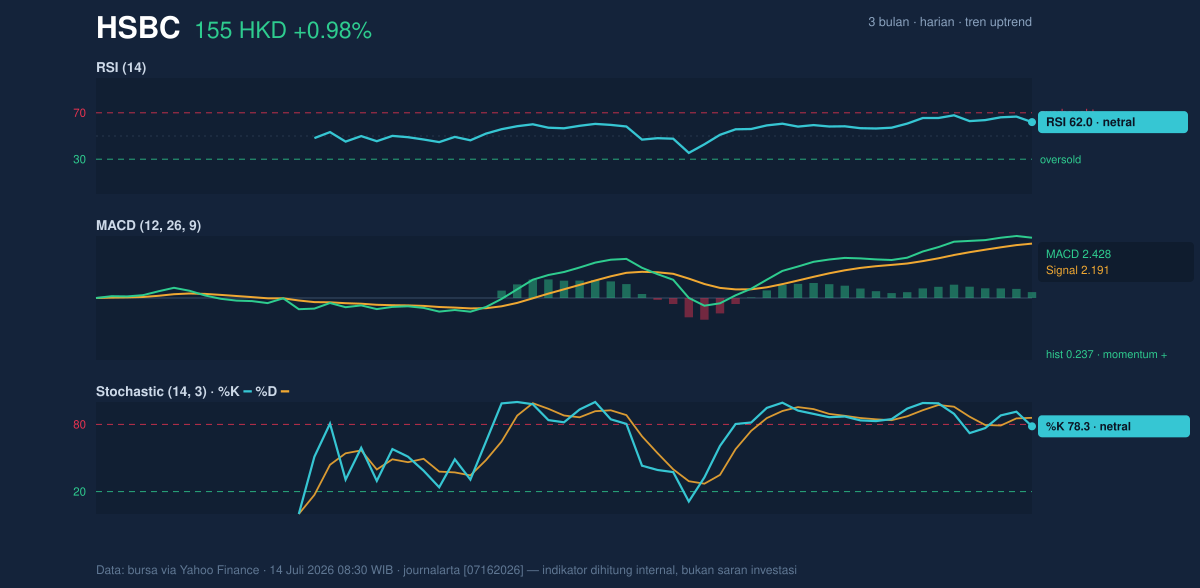
While the MACD reflects positive momentum, the Stochastic %K at 78.3 is trailing the %D at 85.9, hinting at a potential pause in the rapid ascent. When the faster %K line dips below the slower %D line, it often acts as an early warning that the immediate buying pressure is losing its edge, though this has yet to translate into a trend reversal.
Volatility & Volume
A notable feature of the current chart is the Bollinger Band squeeze; with a bandwidth of 6.7%, the narrowness suggests that the stock is coiling for a more significant move. The Average True Range (ATR) of 2.45 underscores a moderate volatility environment, roughly 1.6% of the share price, meaning the stock is currently prone to steady, non-erratic movements.
Trading participation has been uncharacteristically quiet, with volume at 10,672,156 shares—roughly 0.7x the 20-day average. While low volume during an uptrend is typically viewed with skepticism, the rising On-Balance Volume (OBV) serves as a crucial counter-signal, suggesting that while the number of participants is lower, the existing capital is aggressively bidding the price higher rather than distributing.
Technical Verdict: HOLD (wait & see)
The current technical setup suggests that while the trend is positive, the stock is entering a potential "extension" phase where the risk-to-reward ratio for new entries is temporarily compressed.
* Hold Rationale: The stock has successfully broken above the 153.80 HKD resistance, but the Bollinger %B at 105% suggests it is overextended in the very short term. A lack of volume confirmation warrants patience.
* Invalidation: The bullish outlook is invalidated if the price falls below the SMA20 support of 149.80 HKD, which would signal a breakdown in the current momentum.
* Ideal Entry Range: 149.80 HKD – 151.00 HKD (on a retest of the mean).
* Exit Target: 158.00 HKD (projected based on recent expansion).
* Stop Loss: 145.80 HKD (previous 20-day support).
The market is watching to see if the stock can consolidate its recent gains above the 153.80 HKD level to confirm it as a new floor before attempting further moves.
The bank’s next major release cycle begins with the official filing update scheduled for early August.
Summary Data HSBC
| Last price | 155.30 HKD |
| Change 1 day / 5 days / 1 month | 0.98% / 1.30% / 8.75% |
| Trend / MA-cross | uptrend / none |
| SMA20 / SMA50 | 149.80 / 145.07 |
| RSI (14) / Stochastic %K | 62.0 / 78.3 |
| Bollinger %B / ATR | 105% / 2.45 |
| Support / Resistance 20 days | 145.80 / 153.80 |
| Data as of | 14 Juli 2026 08:30 WIB |


