Testing Key Resistance, Alibaba Stock Gains 2.44% Today
Technical analysis of Alibaba stock on Juli 16, 2026: price 113.40 HKD, trend sideways, RSI 56.1, support 89.50, resistance 110.80. Key angle: Testing Key…

Alibaba Group (9988.HK) shares vaulted 2.44% in Monday’s session to close at 113.40 HKD, marking a significant 18.37% recovery over the past five trading days. This surge places the stock firmly above its 20-day Simple Moving Average (SMA20) of 101.36, signaling a shift in short-term sentiment even as the longer-term structural trend remains defined by the 50-day SMA of 116.76.
Trend & Price Action
The recent price action indicates a decisive breakout from the previous 20-day support/resistance range of 89.50 to 110.80. By closing at 113.40, the stock has effectively pierced its near-term ceiling, a move supported by the Bollinger Band %B at 93%, which suggests price is testing the upper extremity of expected volatility. With the SMA20 sloping at -0.97%, the rapid price appreciation is currently "outrunning" the average, creating a steep divergence between current levels and the moving averages.
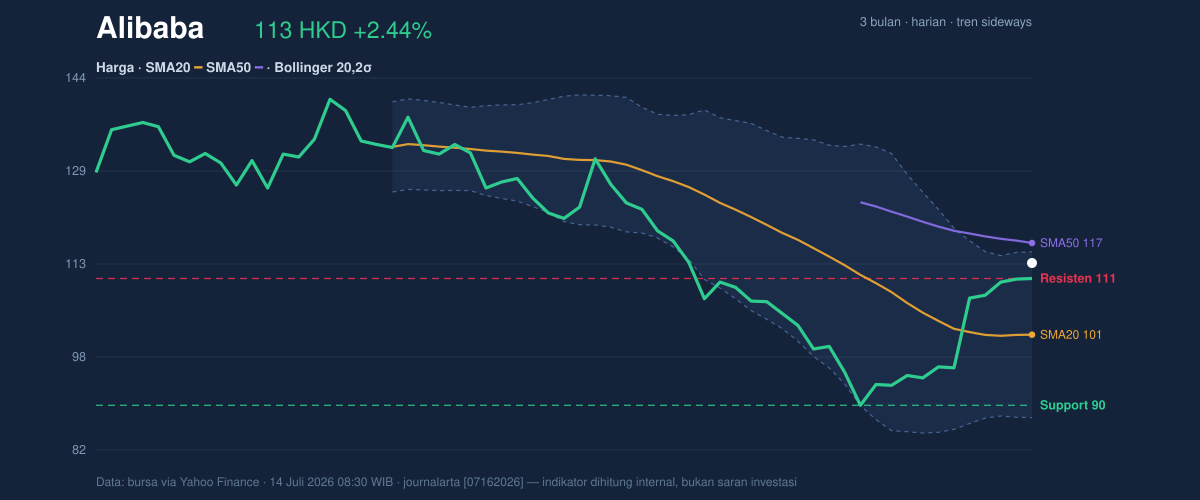
The gap between the current price and the SMA50 of 116.76 acts as the primary hurdle. Should the stock consolidate these gains, the 116-117 level represents the next major test of institutional interest.
Oscillators & Momentum
While the price trend shows vigor, momentum indicators suggest the rally may be entering a temporary stretch phase. The RSI is at 56.1, which remains in neutral territory—neither overstretched nor exhausted. However, the Stochastic oscillator shows %K at 83.7 and %D at 85.2, placing the stock in overbought territory.
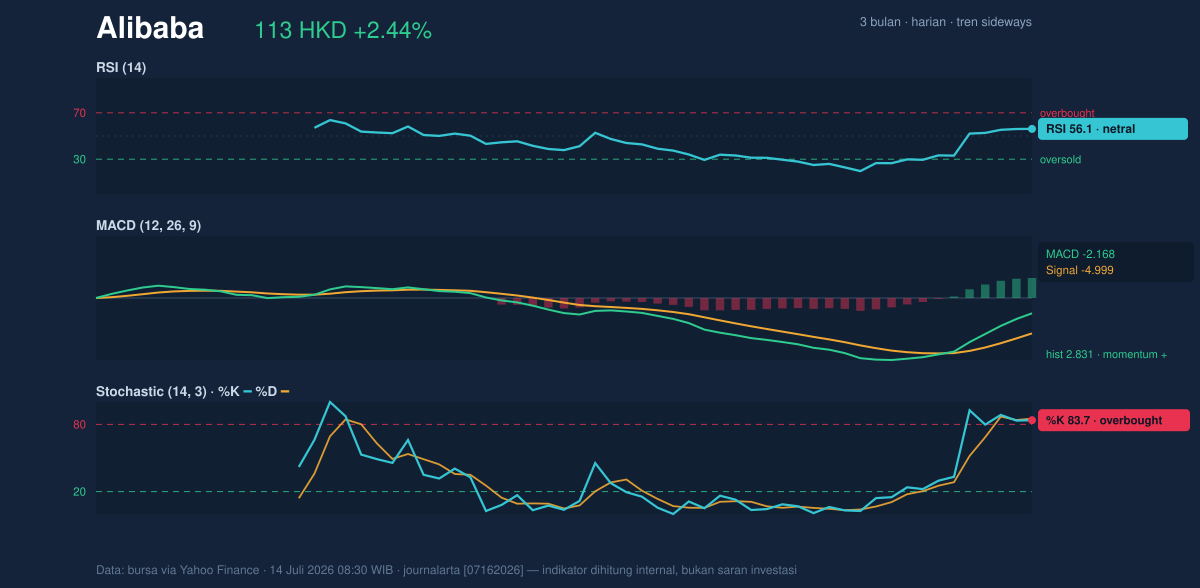
Supporting this is the MACD, which sits at -2.168, but with a positive histogram of 2.831, confirming that the short-term momentum shift is gaining structural backing despite the negative absolute value. The fact that the MACD line is approaching the signal line (-4.999) from below is a classic sign of trend-reversal confirmation.
Volatility & Volume
Market participation during this move has been paradoxically light. With 100,890,456 shares traded, volume is running at roughly 0.9x the 20-day average. While On-Balance Volume (OBV) is rising—indicating that buying pressure is successfully absorbing supply—the lack of high-volume conviction suggests the current move is driven more by a lack of sellers than an aggressive accumulation surge. Volatility remains high, with an ATR of 5.39, representing 4.8% of the share price, meaning investors should prepare for swings of roughly 5 HKD per day as the market finds equilibrium.
Key Levels & Scenarios
The stock is currently trading at 112% of its previous 20-day range, meaning it is technically "expensive" relative to the last month of activity. The immediate upside resistance sits at the 116.76 SMA50 level. If the stock fails to sustain the 110.80 breakout level, a return to the 101.36 SMA20 pivot is probable.
Technical Verdict: HOLD (wait & see)
* Reason 1: The Stochastic is in overbought territory, suggesting a need for a period of price consolidation.
* Reason 2: Trading volume is currently below the 20-day average, casting doubt on the immediate sustainability of the breakout above 110.80.
* Invalidation: This neutral stance is invalidated if the price clears the 116.76 SMA50 on significantly higher volume.
Trading Framework (Informational):
* Ideal Entry Range: 101.36 – 105.00 HKD
* Exit Target: 116.76 HKD
* Stop Loss: 98.00 HKD
The current technical environment suggests that while the momentum is undeniably positive, the stock is reaching a critical inflection point where a brief cooling-off period would be standard behavior before testing the 50-day moving average.
The 3-month high for the ticker remains at 144.00 HKD.
Summary Data Alibaba
| Last price | 113.40 HKD |
| Change 1 day / 5 days / 1 month | 2.44% / 18.37% / 2.90% |
| Trend / MA-cross | sideways / none |
| SMA20 / SMA50 | 101.36 / 116.76 |
| RSI (14) / Stochastic %K | 56.1 / 83.7 |
| Bollinger %B / ATR | 93% / 5.39 |
| Support / Resistance 20 days | 89.50 / 110.80 |
| Data as of | 14 Juli 2026 08:30 WIB |



