AIA Testing Key Resistance: Stock Gains 5.25% (Juli 16, 2026)
Technical analysis of AIA stock on Juli 16, 2026: price 76.20 HKD, trend sideways, RSI 48.2, support 70.80, resistance 76.50. Key angle: AIA Testing Key…

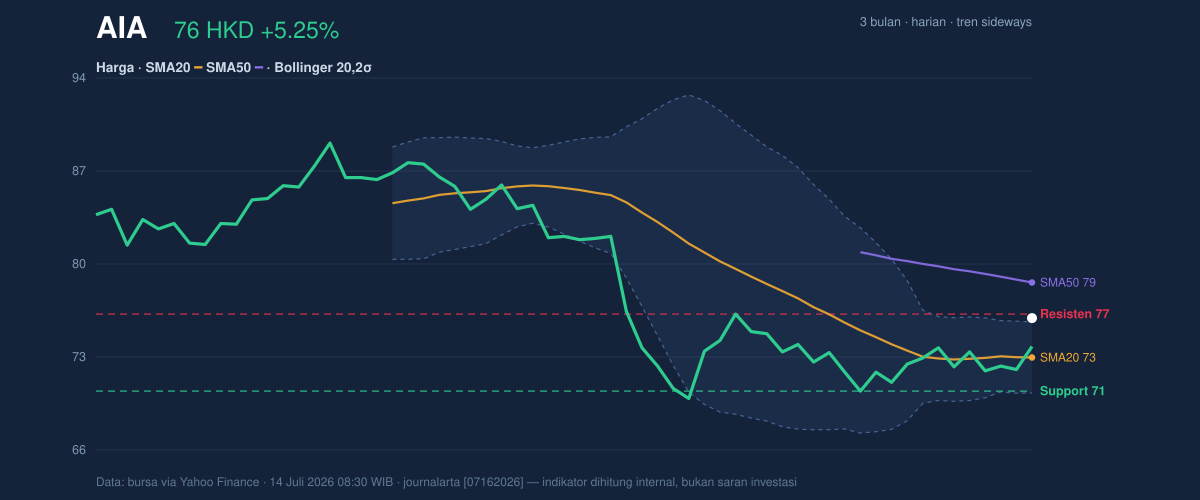
AIA Group (1299.HK) vaulted 5.25% in the latest session to close at 76.20 HKD, signaling a sharp departure from the lethargy that has defined its recent sideways consolidation. This move, while aggressive, brings the insurance giant right to the doorstep of its 76.50 HKD resistance level, a critical threshold defined by the stock's 20-day trading range. By reclaiming the 20-day simple moving average (SMA20) of 73.29 HKD, the equity has successfully invalidated the bearish pressure that previously kept it pinned toward the lower end of its recent channel.
Trend and Price Structure
The market structure for AIA remains tethered to a broader neutral phase, evidenced by the sideways trend and a shallow SMA20 slope of 0.20% over the last five days. While the price sits comfortably above the 73.29 HKD short-term average, it remains firmly below the 78.83 HKD SMA50, suggesting that the primary trend remains corrective or consolidation-based rather than impulsive. The current position at 95% of the 20-day range shows that the buyers are in control of the immediate flow, yet the proximity to 76.50 HKD resistance suggests that overhead supply could stifle further rapid gains.
Volatility and Volume Dynamics
The Bollinger Band analysis reveals a tightening in the price action, with the width at 7.2%, indicating that the market was in a squeeze phase prior to this session’s breakout. The current %B of 105% places the price marginally outside the upper Bollinger Band, which is a classic signal of a "bandwidth expansion" attempt that often precedes volatility. Interestingly, volume remains muted at 0.8x the 20-day average; this divergence between price and participation suggests that the move may be driven by thin liquidity rather than broad institutional conviction. The On-Balance Volume (OBV) rising, however, provides a glimmer of confirmation that underlying accumulation is trickling into the stock.
Oscillators and Momentum
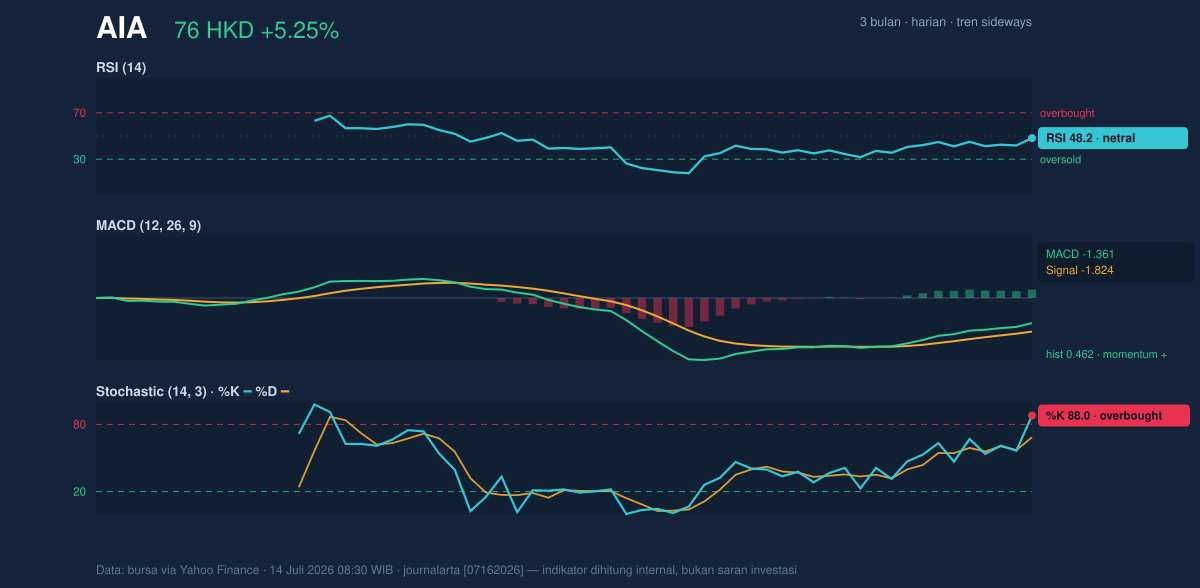
Momentum indicators provide a conflicting narrative that demands caution. The MACD line at -1.361 has crossed above its signal line at -1.824, generating a positive histogram of 0.462, which reinforces the short-term bullish impulse. Conversely, the Stochastic %K at 88.0 indicates that the stock has entered overbought territory, warning that the immediate momentum is extended. The RSI at 48.2 remains resolutely neutral, suggesting that despite the sharp single-day jump, the broader market sentiment has not yet shifted into a full-blown bullish regime.
Technical Verdict: HOLD (wait & see)
The current setup favors a cautious approach rather than aggressive positioning, as the stock is hitting a technical ceiling with stretched momentum.
* Bullish Evidence: Price is above SMA20; MACD shows a positive crossover; price closed above the upper Bollinger Band.
* Bearish Constraints: Stochastic is overbought; trading volume is below average; price remains below SMA50 (78.83 HKD).
* Invalidation Condition: This sentiment is invalidated if the price falls below 73.29 HKD, signaling a failure to hold the breakout.
Strategy parameters:
* Entry Range: 73.30 – 74.00 HKD (on a pullback to test the SMA20)
* Exit Target (Resistance): 76.50 – 78.80 HKD
* Stop Loss Protection: 70.80 HKD (Support level)
The market is currently testing a significant psychological ceiling, and participants are waiting for high-volume confirmation before committing to a sustainable trend reversal.
Summary Data AIA
| Last price | 76.20 HKD |
| Change 1 day / 5 days / 1 month | 5.25% / 4.96% / 2.21% |
| Trend / MA-cross | sideways / none |
| SMA20 / SMA50 | 73.29 / 78.83 |
| RSI (14) / Stochastic %K | 48.2 / 88.0 |
| Bollinger %B / ATR | 105% / 2.05 |
| Support / Resistance 20 days | 70.80 / 76.50 |
| Data as of | 14 Juli 2026 08:30 WIB |



