Keppel Stock Week Ahead: Technical Outlook for November 9–13
Keppel stock week ahead for November 9–13: last close 9.45 SGD, weekly change -6.34%, support 9.45, resistance 10.43.
By matthew jonathan
November 8, 20264 min read
Advertisement
Logo Keppel Ltd — JournalArta illustration
Keppel enters the Singapore trading week of November 9–13 at S$9.45, after a sharp weekly decline left the stock near its recent trading floor. The close was 6.34% lower than a week earlier. Pressure remained heavy into Friday.
The stock opened the week at S$10.09 and reached a high of S$10.15 on November 2, before falling to a weekly low of S$9.30 on November 6. Its S$9.45 finish was just 18% of the way up the week’s S$9.30–S$10.15 range. Four sessions fell and one rose; the strongest was November 4, up 1.02%, while Friday was the weakest, down 4.93%.
Trading activity added weight to the decline. Average daily volume was 4,858,758 shares, 1.25 times the average for the preceding 20 sessions. Friday’s volume reached 8,908,270 shares, or 2.4 times its 20-session average, as the price fell.
Last Week in Review
The weekly loss was 6.34%, matching the move from the October 30 close of S$10.09 to the November 6 close of S$9.45. The week’s extremes were S$10.15 on November 2 and S$9.30 on November 6. Friday’s 4.93% drop was both the worst session and the point at which the stock finished close to the weekly low.
Volume was above its earlier baseline for the week and surged on Friday. That combination—an accelerating fall on unusually high turnover—signals that selling pressure was not confined to a quiet, low-volume retreat.
Advertisement
Technical Map for the Week Ahead
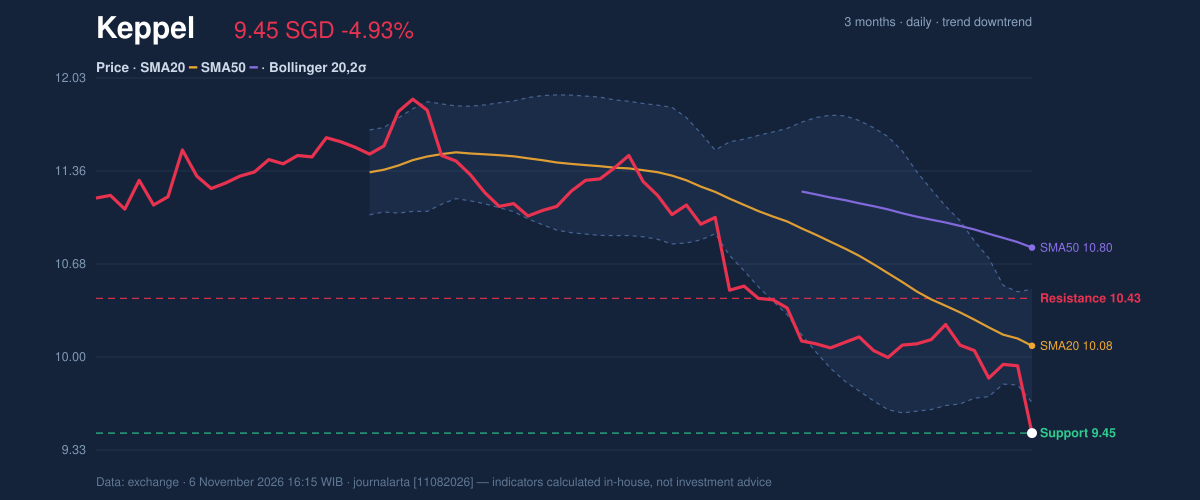
The chart’s near-term map is defined by support at S$9.45 and resistance at S$10.43, the respective 20-day reference levels. The three-month range runs from S$9.30 to S$11.91. The lower end is close to Friday’s low, making the S$9.30 mark a further reference if support gives way.
The price is below both its 20-day moving average, at S$10.08, and its 50-day average, at S$10.80. A moving average smooths price fluctuations to show the broader direction; the 20-day average’s slope is falling at 2.36% over five days, consistent with a downtrend. There has been no new moving-average crossover.
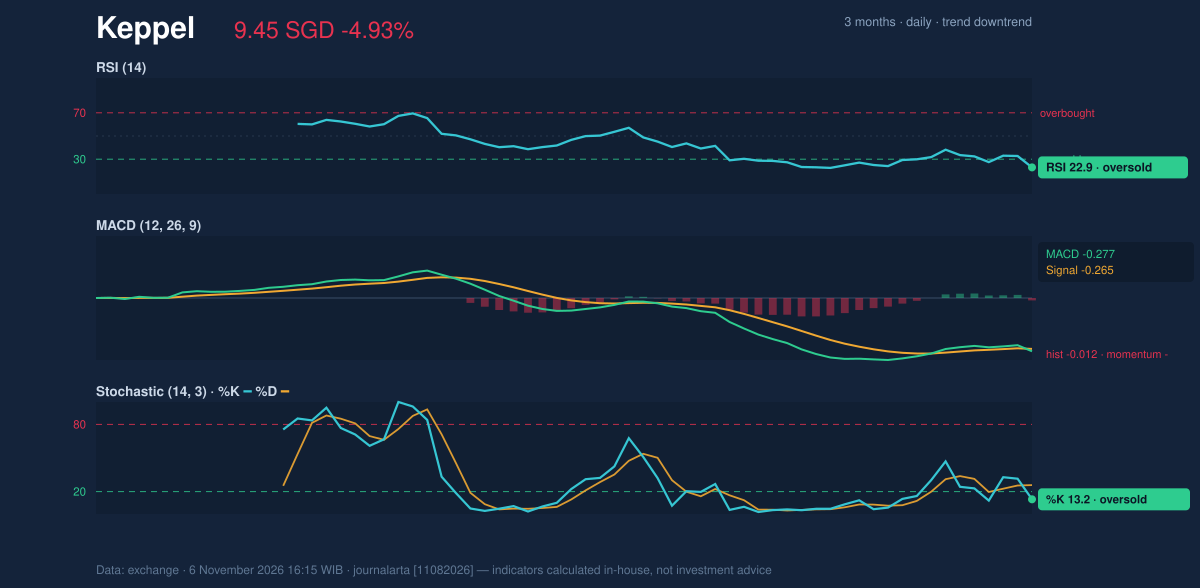
Momentum readings are weak but stretched. The RSI is 22.9 and stochastic readings are also in oversold territory; these measures track the pace of recent moves, and low readings can indicate that a decline has become extended, though they do not establish a reversal. MACD is negative at -0.277, with its histogram at -0.012, pointing to negative momentum. The Bollinger lower band is S$9.67, above the close; Bollinger bands measure price relative to recent volatility, and a close below the lower band indicates unusually weak positioning. The band width is 8.2%, described as normal.
3-month price action chart of Keppel: price, SMA20/50, Bollinger, support & resistance.
Advertisement
The price chart captures the break below the lower band and the close at the 20-day support reference. Volume and falling OBV—the running tally of volume associated with rising or falling prices—add to the negative picture. The computed technical bias is BEARISH, with four of seven signals bearish and none bullish.
Momentum chart of Keppel: RSI(14), MACD, Stochastic.Bullish scenario: A move back above S$9.80, the supplied price-plus-1.5-ATR reference, would be an initial recovery marker. A break above S$10.43 would clear the 20-day resistance and strengthen the case for a broader rebound.
Bearish scenario: A break below S$9.45 would put the 20-day support under pressure. A fall through S$9.30, the three-month low, would extend the breakdown beyond the recent range.
Risks and What Would Invalidate the Scenario
The bearish reading is vulnerable to a sustained recovery above S$10.43, which would take the price back through 20-day resistance. Oversold RSI and stochastic readings also leave room for a sharp counter-move, even while the trend remains down. Conversely, a break below S$9.45 would weaken the current support reference, with S$9.30 the next defined floor in the supplied data.
The lower Bollinger band at S$9.67 and the close at S$9.45 show how far price has moved beyond its recent volatility envelope. That can accompany continued selling, but it also raises the risk of a rebound; neither indicator alone confirms what the next session will do.
Advertisement
Technical Verdict for the Week: SELL
SELL is the data-based technical verdict, matching the bearish signal classification. The strongest reasons are the close below the S$10.08 SMA20 while that average is falling; the negative MACD histogram of -0.012; and Friday’s heavy volume alongside falling OBV and a close below the lower Bollinger band.
The verdict is invalidated if the price breaks above S$10.43, the 20-day resistance level.
- Entry range: S$9.45–S$9.80, using the 20-day support and price-plus-1.5-ATR reference.
- Target price: S$9.30, the three-month low.
- Stop loss: S$9.80, the supplied price-plus-1.5-ATR level.
For non-traders, the chart signals that downward pressure remains dominant, although oversold readings leave room for a rebound.
Keppel Week Ahead Data
Trading week
November 2 – November 6 (5 sessions)
Weekly change
-6.34% (10.09 → 9.45 SGD)
Week high / low
10.15 (November 2) / 9.30 (November 6)
Best / worst session
1.02% (November 4) / -4.93% (November 6)
Avg daily volume vs prior 20 sessions
4,858,758 vs 3,884,541 (1.25x)
SMA20 / SMA50
10.08 / 10.80
RSI (14) / Stochastic %K
22.9 / 13.2
Support / Resistance 20 days
9.45 / 10.43
3-month high / low
11.91 / 9.30
Week covered
November 9–13, 2026
Data as of
6 November 2026 16:15 WIB
Advertisement
Disclaimer: This technical analysis is generated automatically from exchange data and indicators calculated by JournalArta, for information and education only. The verdict and the entry, target and stop-loss levels are not investment advice or a solicitation to buy or sell any security. Investment decisions and their risks rest solely with the reader.