Alibaba Stock Week Ahead (November 9–13): What Comes After a 8.09% Weekly Gain
Alibaba stock week ahead for November 9–13: last close 104.90 HKD, weekly change 8.09%, support 96.10, resistance 110.50.
By Alistair Sterling
November 8, 20264 min read
Advertisement
Logo Alibaba Group — JournalArta illustration
Last Week in Review
Alibaba shares on HKEX rose 8.09% in the week to November 6, closing at 104.90 HKD after a volatile five-session run. The advance was broad, but the finish was weak: the stock gained in four sessions and fell in one, with its best day on November 5, up 8.45%, followed by its worst on November 6, down 3.85%.
The shares traded between 96.90 HKD on November 4 and 109.40 HKD on November 5. The close sat at 64% of that weekly range, below the high after the late-week reversal. Average daily volume reached 87,626,165 shares, or 1.46 times the 20-session pre-week average of 60,071,303, indicating heavier participation in the move.
Technical Map for the Week Ahead
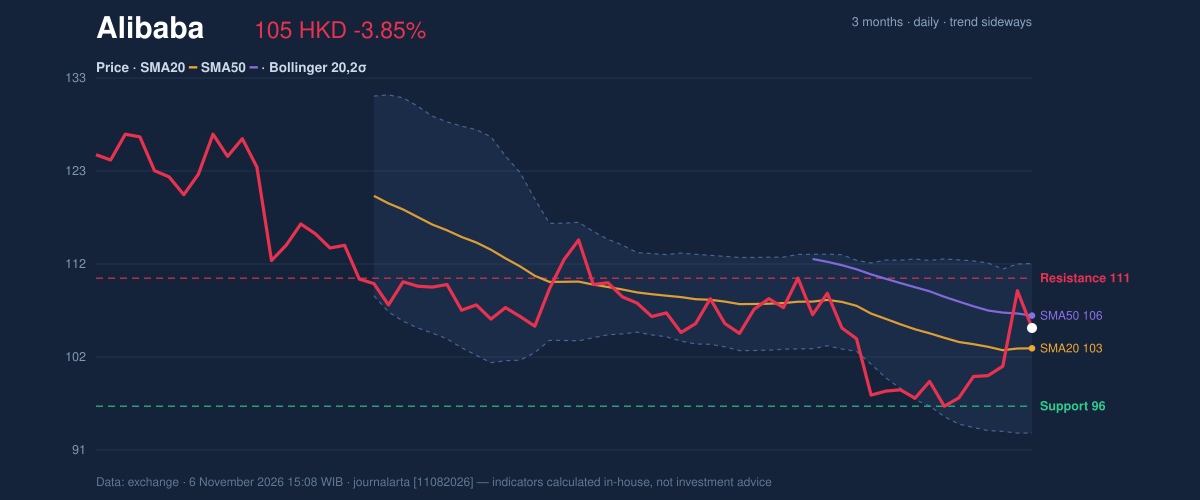
The chart enters November 9–13 with mixed signals rather than a confirmed trend change. The price at 104.90 HKD is above the 20-day moving average at 102.62 HKD, but below the 50-day average at 106.30 HKD. The 20-day average’s slope is negative, while the technical trend reading is sideways. No new moving-average crossover has formed.
Near-term support is at 96.10 HKD, with resistance at 110.50 HKD. The broader three-month range runs from 95.10 to 130.30 HKD. On the Bollinger measure, which tracks price relative to a moving average and its usual range, the middle band is 102.62 HKD, the upper band 112.16 HKD and the lower band 93.09 HKD. The band width is 18.6%, classed as normal, and the price is at 62% of the band range.
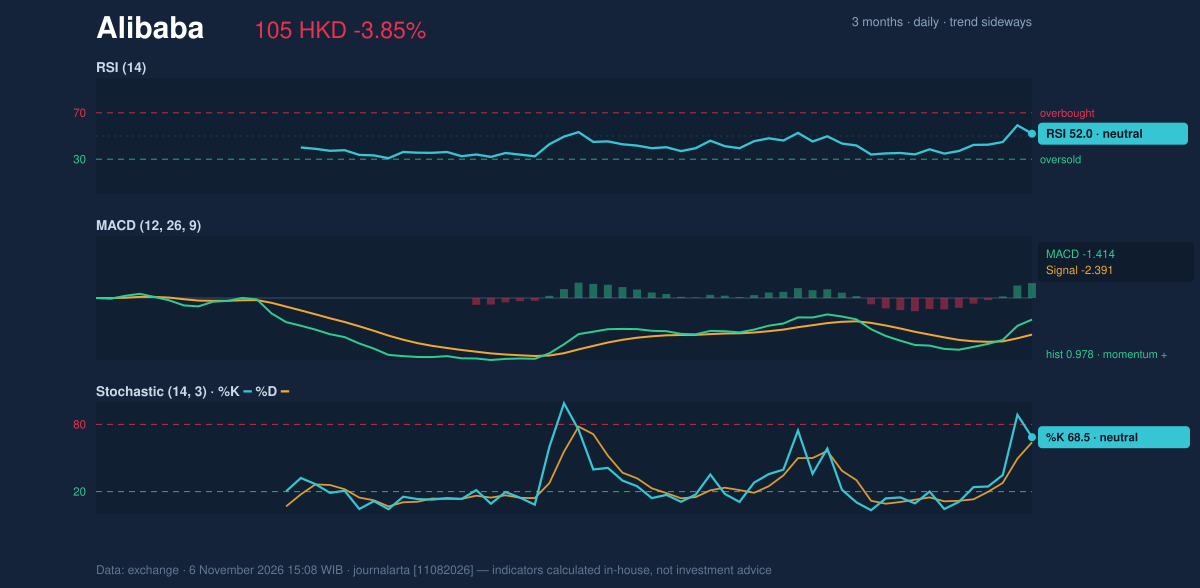
Momentum is also divided. RSI, a measure of the pace of recent gains and losses, stands at 52.0, a neutral reading; stochastic readings are likewise neutral at 68.5 and 64.0. MACD remains below zero at -1.414, but its histogram has turned positive at 0.978, while the signal line is -2.391. That combination suggests improving short-term momentum, not yet a clear reversal. The chart below shows the key price levels.
3-month price action chart of Alibaba: price, SMA20/50, Bollinger, support & resistance.
Advertisement
The momentum chart helps show why the positive histogram has not settled the wider technical picture.
Momentum chart of Alibaba: RSI(14), MACD, Stochastic.Bullish scenario: A break above 110.50 HKD would clear 20-day resistance and put the 112.16 HKD upper Bollinger band into view as a technical reference.
Bearish scenario: A fall below 96.10 HKD would breach 20-day support; the three-month low at 95.10 HKD is the next reference level.
Fundamentals and Catalysts
Alibaba’s business spans consumer platforms and technology infrastructure, giving the stock exposure to more than one part of China’s digital economy. A company overview published on November 6 describes its role as providing technology infrastructure and marketing reach to merchants, brands, retailers and other businesses in China and internationally.
The same overview, published on November 6, identifies four operating groups: Alibaba China E-Commerce, Alibaba International Digital Commerce, Cloud Intelligence and All Others. Within the China e-commerce group, Taobao and Tmall are digital retail platforms; Taobao Instant Commerce covers local services and on-demand delivery, alongside a domestic wholesale marketplace and Xianyu, a consumer-to-consumer marketplace for idle goods. These details matter because the business is not limited to one online shopping channel, although the supplied research provides no new financial results or dated company event for the coming week.
Advertisement
Macro, Political and Global Factors
The research provided contains no dated macroeconomic, political or policy developments, or global-market facts relevant to Alibaba for November 9–13. No external catalyst is included in this analysis.
Risks and What Would Invalidate the Scenario
The main technical risk is that the recent rebound is occurring while the share price remains below the 50-day average at 106.30 HKD and the 20-day average slopes down by 0.68% over five days. That keeps the recovery vulnerable to renewed selling. The November 6 drop came on volume of 95,566,833 shares, 1.3 times the 20-session average, while average weekly volume was also elevated.
The neutral technical bias reflects the balance: the MACD histogram has turned positive, but that is the only bullish signal among seven assessed; one bearish signal is the rebound into the 20-day average within a downtrend, with price below the 50-day average. A move below 96.10 HKD would invalidate the support-holding scenario; a break above 110.50 HKD would invalidate the immediate resistance-led bearish case. The ATR, a measure of typical price movement, is 4.06 HKD, or 3.9% of the share price, pointing to high volatility.
Advertisement
Technical Verdict for the Week: HOLD
HOLD (wait & see) fits the neutral technical bias. RSI at 52.0 is neutral, the share price is above its 20-day average but below its 50-day average, and the positive MACD histogram at 0.978 suggests momentum is improving without confirming a broader trend reversal.
The verdict is invalidated if the price breaks below 96.10 HKD, the 20-day support level.
Entry range: 102.62–106.30 HKD, bounded by the 20-day and 50-day moving averages.
Target reference: 110.50 HKD, the 20-day resistance.
Stop reference: 96.10 HKD, the 20-day support.
In plain English, the chart is neither strong enough to confirm a sustained recovery nor weak enough to rule one out.
Alibaba Week Ahead Data
Trading week
November 2 – November 6 (5 sessions)
Weekly change
8.09% (97.05 → 104.90 HKD)
Week high / low
109.40 (November 5) / 96.90 (November 4)
Best / worst session
8.45% (November 5) / -3.85% (November 6)
Avg daily volume vs prior 20 sessions
87,626,165 vs 60,071,303 (1.46x)
SMA20 / SMA50
102.62 / 106.30
RSI (14) / Stochastic %K
52.0 / 68.5
Support / Resistance 20 days
96.10 / 110.50
3-month high / low
130.30 / 95.10
Week covered
November 9–13, 2026
Data as of
6 November 2026 15:08 WIB
Advertisement
Disclaimer: This technical analysis is generated automatically from exchange data and indicators calculated by JournalArta, for information and education only. The verdict and the entry, target and stop-loss levels are not investment advice or a solicitation to buy or sell any security. Investment decisions and their risks rest solely with the reader.