NetEase Share Price Rises 0.40% on Friday, Golden Cross Formed
Technical analysis of NetEase stock on November 6, 2026: price 200.40 HKD, trend sideways, RSI 63.0, support 172.40, resistance 200.40.

Why NetEase is in focus today
- Volume at 1.8× the 20-day average
- Closed at a 20-day high (200.40)
- Fresh golden cross: SMA20 crossed above SMA50
Selected automatically from 72 HKEX (Hong Kong) stocks by a technical-signal score with daily weighted randomisation — not a recommendation.
Trend & Price Action
NetEase gained 0.40% in one day, 13.41% over five days and 7.45% over one month, according to the supplied exchange data. The broader trend is still classified as sideways, but the short-term picture has strengthened: the share price is above both the HK$188.28 20-day average and the HK$187.40 50-day average. The 20-day average itself rose 0.29% over five days, a modest slope that points to gradual improvement rather than a steeply accelerating trend. The golden cross formed one session before the latest session. That timing matters: it is a recent change in the relationship between the averages, not a signal that appeared during Friday’s trading. The close at the 20-day high, alongside volume 1.8 times its average and rising OBV—a measure that tracks whether volume is flowing more heavily on up days—suggests buyers participated in the move. But the price is also at the 20-day resistance, so the next test is whether it can hold above that threshold. As shown in the chart, the close is near the upper Bollinger band, while the three-month high remains above it.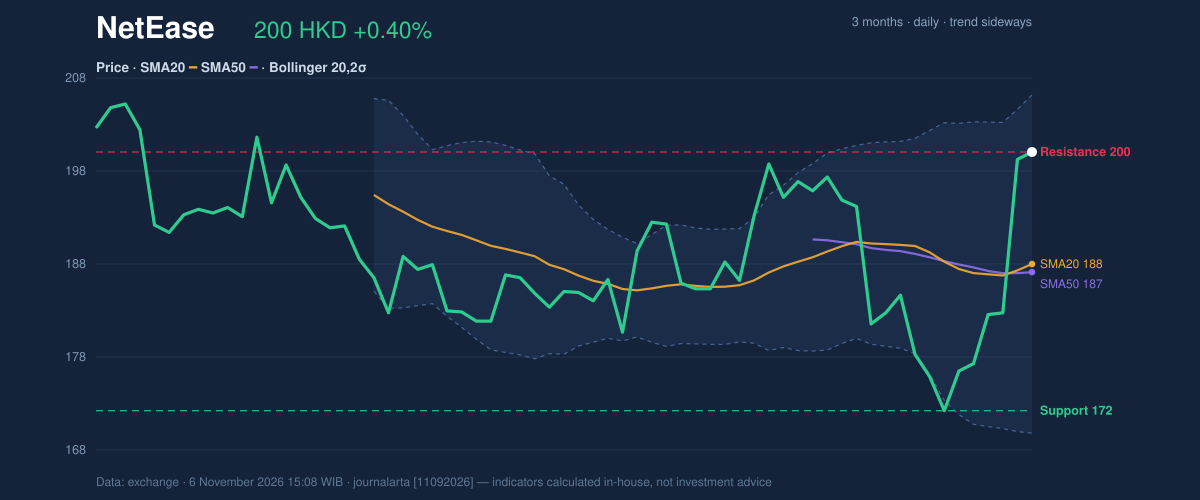
Oscillators & Momentum
Momentum signals are positive but not unanimous. The MACD histogram has turned positive at 1.635, with MACD at 0.020 versus a signal line of -1.615. This indicates that recent upward momentum has improved relative to its prior trend, though it does not guarantee further gains. The RSI is 63.0, in neutral territory, leaving it short of an overbought reading. The Stochastic oscillator is less comfortable: %K at 89.5 and %D at 73.4 are overbought. Stochastic compares a close with its recent trading range; a high reading can signal that prices have risen quickly and may be due for consolidation. That caution tempers, but does not erase, the positive MACD and moving-average signals.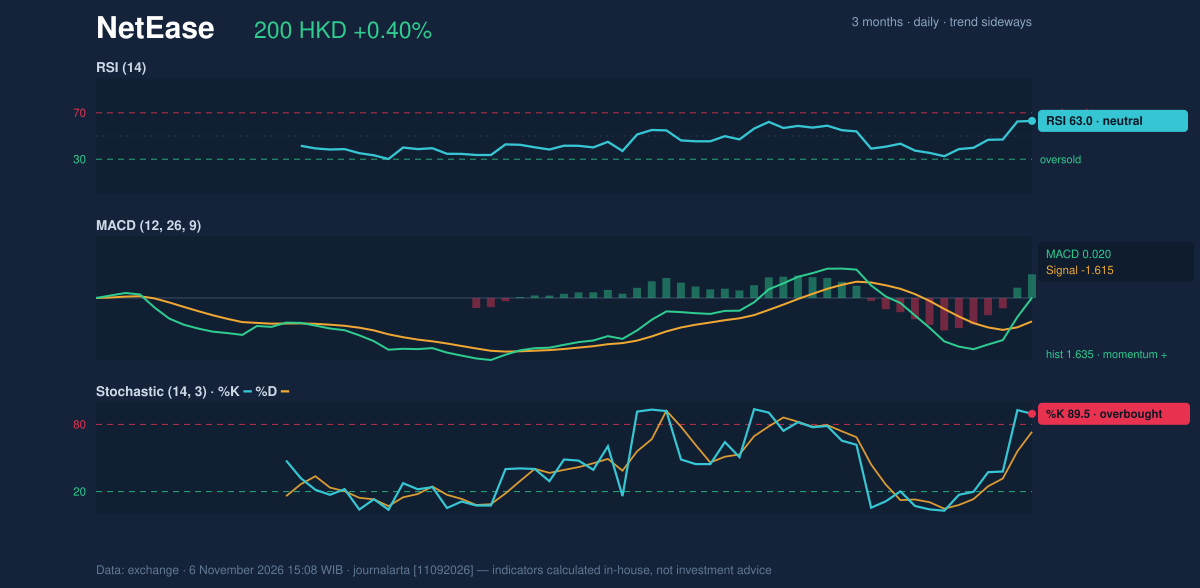
Volatility, Volume & Levels
The Bollinger bands have normal width, not a squeeze that would suggest unusually compressed trading. With %B at 83%, the price sits in the upper part of the band, whose upper edge is HK$206.58. The HK$200.40 close is also the 20-day resistance; above it, the three-month high at HK$210.60 is the next reference point. A sustained move beyond resistance would put that earlier high in focus, while failure to hold the breakout area could bring the moving averages into view. Volatility is material: ATR is HK$7.47, or 3.7% of the share price. ATR estimates the typical trading range, not the direction of the next move. The 20-day support is HK$172.40, close to the three-month low of HK$171.50. Those levels mark a much wider downside reference than the near-term moving averages, underscoring that a technical breakout can still carry substantial price swings.Technical Verdict: BUY
The supplied technical bias is bullish, with three of seven signals positive and none bearish. The strongest support for that reading is the recent golden cross, the close at the 20-day high on volume 1.8 times average, and the MACD histogram’s turn positive. The overbought Stochastic and elevated ATR remain risks to the path, rather than evidence in this dataset of a bearish reversal. The technical picture is bullish, but the overbought Stochastic and high volatility make follow-through less certain. - Ideal entry range: HK$188.28–HK$200.40, between the 20-day average and the 20-day resistance. - Exit target: HK$210.60, the three-month high and next resistance reference above the 20-day level. - Stop-loss protection: HK$172.40, below the 20-day support. - Invalidation: The bullish verdict is invalidated if the price falls below HK$172.40. For non-traders, the indicators point to improving momentum, but the share is already testing resistance and could retreat before any further advance. | Indicator | Reading | |---|---:| | Last price | HK$200.40 | | Change: 1 day / 5 days / 1 month | 0.40% / 13.41% / 7.45% | | SMA20 / SMA50 | HK$188.28 / HK$187.40 | | Golden cross | Formed 1 session before latest session | | RSI(14) | 63.0, neutral | | Stochastic %K / %D | 89.5 / 73.4, overbought | | MACD histogram | 1.635, positive | | Bollinger %B / band width | 83% / 19.4%, normal | | ATR(14) | HK$7.47, 3.7% | | Volume / 20-day average | 12,672,215 / 7,117,904 | | 20-day support / resistance | HK$172.40 / HK$200.40 | | Three-month low / high | HK$171.50 / HK$210.60 |Summary Data NetEase
| Last price | 200.40 HKD |
| Change 1 day / 5 days / 1 month | 0.40% / 13.41% / 7.45% |
| Trend / MA-cross | sideways / golden |
| SMA20 / SMA50 | 188.28 / 187.40 |
| RSI (14) / Stochastic %K | 63.0 / 89.5 |
| Bollinger %B / ATR | 83% / 7.47 |
| Support / Resistance 20 days | 172.40 / 200.40 |
| Data as of | 6 November 2026 15:08 WIB |
Disclaimer: This technical analysis is generated automatically from exchange data and indicators calculated by JournalArta, for information and education only. The verdict and the entry, target and stop-loss levels are not investment advice or a solicitation to buy or sell any security. Investment decisions and their risks rest solely with the reader.
Track NetEase share price daily: live levels, support/resistance and our full NetEase analysis history.